Category Focus/categories/developer-tools
Developer Tools AI Tools
Discover and compare the best developer tools AI tools and software. Browse 571+ curated tools with reviews and rankings.
Projects tracked
571
Sort mode
RECENT
Page
6
Discover and compare the best developer tools AI tools and software. Browse 571+ curated tools with reviews and rankings.
Projects tracked
571
Sort mode
RECENT
Page
6
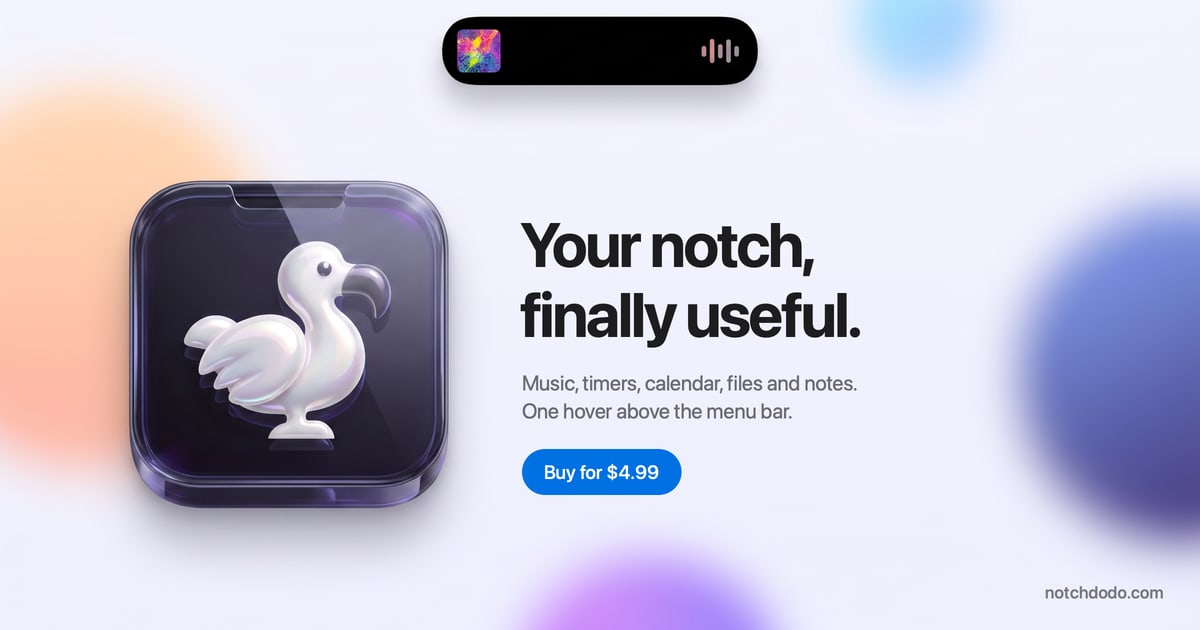
NotchDodo is a macOS app that turns the notch at the top of a MacBook display into a Dynamic Island-style panel, giving Mac users quick access to a set of everyday utilities without interrupting their work. Hovering above the menu bar opens a dark dashboard that holds music controls, timers, today's calendar, files, notes and AI agent usage in one place. It is built specifically for Macs with a notch, and it also runs on Macs without one by drawing a simulated island at the top centre of the screen. The app is a one-time purchase aimed at anyone who wants the notch to become a useful part of their daily workflow rather than dead space. On modern MacBooks the notch is a piece of hardware that most software simply works around. Menu bar icons slide behind it and vanish when a lot of apps are running, and everyday information such as the current track, a running timer or the next meeting tends to be scattered across separate apps and separate windows. NotchDodo takes the opposite approach: instead of ignoring the notch, it treats it as a surface that can show what matters right now. The result is that the user does not have to switch apps, hunt through invites or dig through logs to know the shape of their day or what their coding agents are doing. The Dashboard is the home page of the notch. It shows eight tiles on a dark panel separated by hairlines, and the user chooses which eight appear and in what order by clicking the gear. Today, Tasks, Notes and Reminders appear in miniature, each one tap away from its full tool. A Launcher shows the apps in the Dock five at a time, Day Progress tracks the workday set in Settings and rotates a short focus tip, and quick toggles cover Dark mode, Keep awake, Screenshot, Lock screen and Empty Trash. Music, AI Usage, System, Shelf and Screen Time tiles can be swapped in and reordered. Pomodoro is a watch-style dial with tick marks and a gold hand; starting a session moves the countdown into the notch so it stays visible while the user works in any app. Five modes cover the day — Work, Short break, Long break, Quick timer and Custom — and focus sounds play rain, café chatter or white noise with each focus block, fading out when the break begins. Every fourth completed session earns a long break, Focus Target attaches a session to an event, reminder or task, and a stopwatch with laps covers everything that is not a Pomodoro. AI Usage reads the session logs that Claude Code, Codex and Gemini CLI already keep on the Mac and turns them into a live picture: tokens today, estimated cost at API list prices, and the five-hour window with its budget bar, burn rate and reset time. Each session shows its state — Running, Waiting or Done — along with the model, the git branch and the last prompt typed. Model tags cover Fable, Opus, Sonnet, Haiku and Gemini, with a CLI tag and a seven-day chart, and while an agent runs the notch shows a purple burn bar and token count and flashes when the window crosses 80 and 100 percent. The budget is learned from the largest past window or set manually in Settings. Dev Servers lists every local server that is running, with its port, the project folder it was started in and the framework such as Next.js, Vite, Django, Rails or Postgres, so a server can be opened in the browser or stopped with a click, ending the "port 3000 is already in use" problem. Menu Bar lists every menu bar icon, marks the ones the notch is covering and opens any of them with a click, using the system's own reveal button on macOS 27. Today shows every event for the day in a list with a details pane giving duration, location, notes and a countdown to the next start, and Zoom, Meet, Teams, Webex and FaceTime links become a single Join button. Ten minutes before a call the notch shows a countdown without being opened; five minutes before, it opens on the meeting with the Join button and then tucks away. Events come from every calendar enabled on the Mac. Reminders reads real Apple reminder lists through EventKit and syncs back through iCloud, showing counts for overdue, due today and later, with quick add by typing and pressing Return and one-click completion reflected everywhere. Tasks is a to-do list with no setup for the small things that do not deserve a project — the list is kept on the Mac and nowhere else, with an open count, a progress bar for the day and a history of done items. Notes saves as you type, using the first line as the title, storing notes as plain files in the Application Support folder and showing word and character counts plus the time of the last save. Music provides Now Playing controls for Apple Music and the Spotify desktop app, with artwork, a scrub bar and transport controls; while something plays, the notch shows the art and four moving bars. Shelf is a holding area for files: drag them onto the notch from Finder and they wait until needed, then drag them back out into Mail or Slack, AirDrop the lot or reveal them in Finder. Downloads and screenshots land there too, and hovering an image and tapping the wand converts it to PNG or JPG, halves it, shrinks it to 1920 px or compresses it. Calculator handles maths with proper precedence, percentages the way people say them and conversions for units and currencies, updating the result as you type and keeping a history with Return. Screen Time counts active time per app only while the user is actually at the keyboard, leaving out idle time, the lock screen and sleep, and groups apps into categories such as Development, Browsing and Communication with a donut and a bar, a Now card, a daily ranking and insights for the average and longest stretch in one app; every Monday and on the 1st a shareable Wrapped recaps focus time, Pomodoros, cursor distance, meetings, the top app and AI usage. System Analytics shows CPU, memory, storage, network, battery and free disk as tick gauges in the style of a watch face, sampling only while the tab is open. Mirror gives a 4:3 mirrored preview from the built-in camera before a call, starting when the tab opens and stopping when the notch closes. Dodo Run is an endless runner inside the notch, built for the minutes Claude Code is busy; it pauses and shows the alert the moment Claude needs approval, is waiting for a prompt or finishes. Support & Feedback lets users send help requests, reviews, general feedback, feature requests or bug reports from the panel, opening an email with the macOS and app version already filled in. NotchDodo is designed the way the Dynamic Island was built. The notch band and the compact pill never change colour, so they merge with the camera housing, while the panel below is a solid dark dashboard with hairline dividers that reads on any wallpaper. Every size change uses springs rather than slides, overshooting a touch and settling, with digits that roll like a clock and nothing fading in for decoration. Seventeen tools ship in the box, each one a keyboard shortcut away if wanted; turn off ten and the rail shows seven. Permissions are asked for when a tab is opened, never at launch, and the notch stays black and silent until something is worth a glance, then grows a little and shrinks back when the user is done. It handles many things automatically: it shows album art while music plays, a running countdown and ring while focusing, a four-second notice when charging and a warning below twenty percent, a countdown ten minutes before a meeting, tokens over a purple burn bar while an agent works, download progress, a pulsing Claude mark when Claude needs approval, a chime and tick when a timer finishes, and a one-time notice when an update is ready. The benefits follow from that design. Information that would otherwise require switching apps or hunting through windows is one hover above the menu bar, so the user keeps working while staying aware of the next meeting, the running timer, the current track, the files waiting to be dealt with and how much of the AI usage window has been consumed. Because everything is read locally, nothing about the user's tasks, notes, Shelf, screen time, AI usage or Wrapped leaves the Mac; the app only goes online to check the licence when activated and about once a week, to check for updates, once if a trial key is activated, for exchange rates if currencies are converted in the calculator, and for Spotify album art while Spotify plays. The focus sounds are made on the Mac, so nothing downloads and they never loop. The app also avoids getting in the way: while another app is using the camera, hovering the notch will not open it and timers will not pop it open over a call, and NotchDodo can be hidden in full-screen apps in Settings. Concrete situations shape the way NotchDodo is used. While a coding agent runs, the user glances at the notch to watch tokens tick up over the burn bar, plays Dodo Run during the wait and sees the Claude mark pulse when approval is needed, then returns to work. Before a call, a countdown appears ten minutes ahead and the notch opens on the meeting with a Join button five minutes before, so no invite has to be searched. During a focus block, a Pomodoro session keeps its countdown in view with rain, café chatter or white noise playing, and a long break is queued automatically after every fourth session. When a file downloads in Safari, Chrome, Edge, Brave or Firefox, its progress shows in the notch and the finished file appears on the Shelf, ready to drag into Slack, while new screenshots wait there too. When local development gets tangled, Dev Servers shows which localhost servers are running and lets the user open or stop one with a click without breaking a coding agent's private helpers. At the end of a week, Screen Time's Wrapped recaps where the time went. NotchDodo is made for Mac users on macOS 14 Sonoma or later on Apple silicon, and Macs without a notch get a simulated island so everything behaves the same. It is a direct download from notchdodo.com rather than an App Store app, so a new version is announced in the notch and downloaded with one click, with no waiting on store review. Pricing is a one-time purchase: $4.99 as a launch price for the first 50 customers, then $14.99, with no subscription and no account. A licence key arrives by email and unlocks the download on 2 Macs, with lifetime updates included, a 14-day refund on request by email, and a private-by-design approach in which nothing leaves the Mac except the licence check. It integrates with Apple calendars, Apple Reminders through EventKit and iCloud, Apple Music, the Spotify desktop app, Claude Code, the Codex CLI and Gemini CLI, and asks for Accessibility access for the Menu Bar tool and camera access for Mirror. NotchDodo turns a piece of Mac hardware that most software works around into a compact dashboard for the day. Seventeen tools, one hover above the menu bar and a one-time price make it a way to keep music, timers, meetings, files, notes and AI agent usage in view without leaving the work in front of you — a more useful Mac, with the notch doing the talking.
Arsaze is an AI-native video editor built for both human editors and AI agents. It presents a real, multi-track timeline — described by its makers as "Cursor for video editing" — where users can cut, rewrite, generate, grade and review footage by hand, or hand control to an AI agent that drives the same timeline. The product positions a single workspace for AI video editing, AI video generation and agent-driven video editing, aimed at people who want a genuine non-linear editor rather than a one-click automation toy. The product addresses a workflow shaped by fragmentation and feedback loss. Generation tools typically live in separate subscriptions, so material has to be downloaded and re-imported before it can be cut, and review notes left by clients tend not to survive the next cut, arriving detached from the frame they describe. Arsaze's answer is to put generation, grading, review and editing on one timeline, and to make that timeline addressable by an AI agent. Its pitch to that audience is simple: stop scrubbing, start directing. Rather than replacing the editing suite with a single automated button, it keeps a conventional multi-track editor at the center and adds an agent as an operator. The first of Arsaze's four power tools is Rewrite, which lets editors treat video like a document. Every clip is transcribed word by word, so the transcript becomes an editable surface: select a sentence and delete it, and the corresponding cut happens on the timeline. The same transcript-driven approach is used to find retakes, strip filler words and shorten pauses. Because the timeline follows the transcript, cleaning up a talking-head recording becomes a text-editing task rather than a scrubbing task. Arsaze also provides word-timed automatic captions in styles that can be reused across a project, and captions are editable like any other clip on the timeline. The Playground is a node editor for generation, usable by both the editor and their agents. Users chain prompts and AI image and video models into reusable graphs — the site gives examples such as Gemini Image into Seedance, or two stills into a single transition — and then drop the result straight onto the timeline. Beyond the Playground, generation is built into the editor across three media types with one credit balance on every paid plan, so there is no tab-hopping between five subscriptions and no downloading and re-importing files. AI video generation covers text-to-video and image-to-video from frontier models including Veo 3.1, Seedance 2.5, Kling 3.0 and PixVerse v6, landing on the timeline as real clips. AI image generation covers stills, thumbnails, style frames and b-roll plates with Nano Banana Pro, Flux 2 Pro, Seedream and Gemini Image. AI audio adds natural voiceover in dozens of languages plus music and sound effects, with ElevenLabs v3 and Multilingual v2 listed. Color is Arsaze's full grading stack, and it can be driven by hand or by asking. It includes a keyer, shot matching, a light tool, color wheels, curves, HSL qualifiers, film-stock LUTs and finishing. Grading is non-destructive and applied per shot, then rendered on export, and editors can import their own .cube files. The site highlights wheels, curves and HSL controls, film and creative LUTs, and the ability to match one shot's look to another. On the audio side, Arsaze offers voice isolation, noise reduction, loudness normalization and automatic ducking under speech. These tools matter because every one of them is also a tool the agent can call, so a request to grade a sequence teal and orange, or to clean a noisy talking-head recording, plays out on the real timeline. Arsaze runs on a dual engine: a real-time multi-track timeline and a code-to-video renderer, side by side in the same edit. The timeline engine offers unlimited video and audio tracks with frame-accurate trims, keyframes, transitions and live preview — the NLE editors already know. The code-to-video engine renders title cards, kinetic type and animated scenes written as code, by a human or an agent, frame-perfect onto the timeline; the site shows a scene definition with a stagger of words, a blur range and an easing curve, rendered at 1080p. Rounding out the toolkit are Remarker, Arsaze's frame-accurate client review tool, automatic version history that versions every edit so cuts can be branched, compared and reverted, and export options covering MP4 from the cloud, free local exports on Windows, and FCPXML for DaVinci Resolve and Premiere Pro. Arsaze works by treating the AI agent as an operator that drives the same timeline a human uses. Setup begins by connecting an agent: Arsaze is added as a custom connector in Claude, ChatGPT or Grok over MCP, a process the site says takes about two minutes and requires no code. The user then states what they want in natural language — the example given is "Cut the silences, add b-roll where I mention the car, grade it teal and orange" — and the agent edits the real timeline, with its tool calls playing back live in the editor. From there the editor reviews and tweaks, stepping in manually at any point, shares a review link, then exports MP4 or FCPXML. Crucially, the agent is optional: Arsaze is a full manual NLE with timeline, trim modes, color wheels and keyframes, and the agent is an operator you can hand the controls to rather than a requirement. Benefits center on control and continuity. Because every edit is versioned automatically as it happens, nothing an agent does is one-way: if the agent makes a bad edit, the editor can step back to any earlier state. Feedback survives the next cut because Remarker pins client comments to the exact frame and version they concern, and because those notes are agent-readable, the agent can read every note and make the fix. Generation arriving directly on the timeline removes the download-and-reimport loop. Exports render on Arsaze's servers by default, so the editor is just a browser tab and no fast machine is required, while Windows users can export locally for free with no watermark. Uploads, generated video and voice models stay tied to the account and are not used to train models without consent. Concrete use cases follow directly from these tools. A creator editing a talking-head video can run one pass to remove dead air and filler words, then fine-tune on the timeline and caption the result with word-timed captions. A marketer or filmmaker can ask an agent to cut silences, place b-roll where a topic is mentioned and grade the sequence teal and orange, then review the result and export. A motion designer can write title cards and kinetic type as code and render them frame-perfect onto the same timeline as the footage. A freelancer or studio can share a Remarker link so clients pin comments to exact frames, reply in threads and rate scenes. Teams finishing in DaVinci Resolve or Premiere Pro can export FCPXML with cuts, transitions and captions intact. Arsaze is aimed at editors, creators, freelancers and studios who want AI assistance inside a real editing environment rather than a black-box generator, and at developers and agent users who already work in tools like Claude, ChatGPT, Grok, Codex, Gemini, Cursor, Windsurf, Zed, Copilot and Perplexity, whose logos the site displays as the agents it is built for. Officially, Claude, ChatGPT and Grok are supported today over MCP. Arsaze runs in the browser and offers a Windows desktop app. Pricing is freemium: a free plan with 50 welcome AI credits, no credit card required, covers audio analysis of videos such as transcripts, captions and silence detection. AI generation of video, image, voice and music and the built-in AI assistant come with paid plans, which add monthly AI credits and cloud export hours; credit top-ups never expire and local Windows exports are always free. Arsaze's primary value proposition is a single, real timeline that both humans and AI agents can drive — the place where AI video editing, AI video generation and agent-driven video editing converge. By combining a manual NLE, a node-based generation Playground, a full color and audio stack, code-to-video rendering, frame-accurate client review, automatic version history and open exports to DaVinci Resolve and Premiere Pro, it lets editors direct rather than scrub, and lets agents do real work on a project that stays fully reversible and under human control.
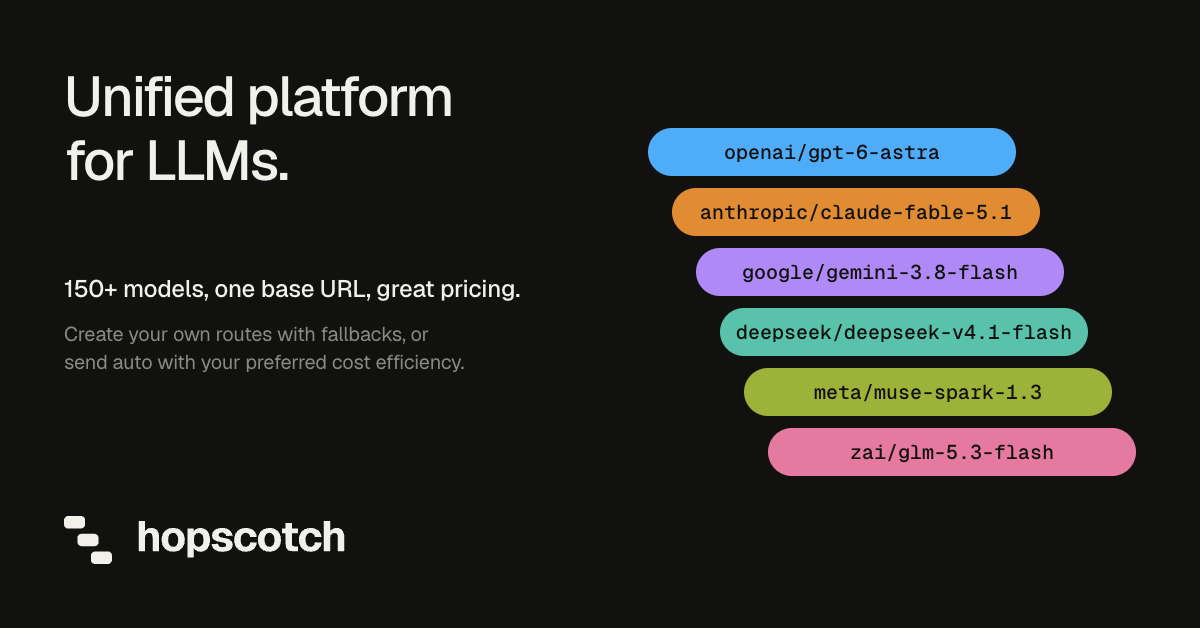
Hopscotch is a single API that gives developers access to more than 500 AI models from Anthropic, OpenAI, Google, DeepSeek, Moonshot AI, Qwen, Meta, and other providers. Instead of creating a separate integration, account, and bill for each provider, a team points the OpenAI SDK it already uses at Hopscotch's base URL, adds a Hopscotch key, and names any model in the catalog. The product is aimed at developers, engineering teams, and AI builders who need access to top models while controlling what those models cost, with spend limits available for every key, teammate, and workspace. The problem Hopscotch addresses is the fragmentation that comes with building on top of multiple AI providers. Each provider normally has its own integration to maintain, its own account, its own payment method, and its own console for usage. A team that wants to run on Anthropic, OpenAI, and Google typically wires up several SDKs and credentials, reconciles several bills, and has no single place to see which model served which request or what the account spent overall. Hopscotch was built as an intelligence layer for AI to remove that overhead; the company states it raised $7.5m to build it. The result is one base URL, one key, and one balance for a catalog of 500+ models, so moving between providers becomes a configuration change rather than a re-integration project. The first capability area is unified access. One key covers models from Anthropic, OpenAI, Google, and others on one base URL, billed to one balance. A request names the model in provider-slash-model format, for example anthropic/claude-sonnet-5, and the endpoints include chat completions and the Responses API, plus a models endpoint that lists every model you can call. Because the interface follows the OpenAI SDK shape, the quickstart shows creating a client with the base URL https://api.hopscotchlabs.ai/v1 and an API key, then calling client.chat.completions.create with any model name from the catalog. A curl example posts to the chat completions endpoint with a bearer token, a model, and messages, which means teams can test the service before touching application code. The second area is model switching. Hopscotch states that once the base URL and key are set, moving to another model means changing the model name only, with no new SDK to install, and the key, balance, and limits stay the same. The model you name is the model that runs: Hopscotch will not swap your model for a different one. If you want another model to take over when your chosen one cannot answer, you list your backups in a routing profile, in the order you choose. The Activity log shows which provider actually served each request, so the model named in code and the provider that answered are both visible, which matters when you are debugging latency, cost, or output quality. The third area is routing and reliability. If a provider has an outage, Hopscotch retries your request first; if you use a routing profile, it then moves to the next model on your list; for chat requests, a final attempt runs your model through a backup provider; if every attempt fails, you get an error. A routing profile can be arranged in the order you choose, such as Sonnet first and GPT, then Gemini, if it fails. When a provider returns a 429, Hopscotch moves the request to another of its keys for that provider, then to the next model in your routing profile, so your code sends one request and gets one response. You can also bring your own provider key: add your own key for a provider such as OpenAI and Hopscotch sends that provider's requests on your key, the provider bills you directly, Hopscotch charges nothing for those requests, and if your key fails Hopscotch does not switch to its own key. Hopscotch also states that it does not change your prompts or the answers, and that by default it never stores your prompts or the model's responses. Some features that providers run on their own servers, such as web search, audio, and hosted tools, are not supported through Hopscotch's provider accounts. The fourth area is spend control and visibility. Each key can be given a credit limit that resets daily, weekly, or monthly; monthly limits can be set for teammates and for the workspace; and the account can be capped by how fast it can spend, $50 by default. A request that would cross a limit is refused before it reaches the provider, which means an agent stuck in a loop cannot drain the balance, and an owner can pause all spending at once. The Activity log lists every request and exports to CSV, showing details such as model, provider, attempts, total tokens, cost, and duration, and a rejected request shows no upstream attempt because it was refused before fetch. Usage breaks spend down by model, provider, key, and teammate, and your code can look up any request's tokens and cost through the API. The fifth area is comparison and catalog transparency. The playground runs one prompt on up to three models side by side, billed through your key like any other request, so you can compare the answers and what each one cost before you change your code. The catalog lists each model with its context window and its price per million tokens; examples shown include anthropic/claude-sonnet-5 at 2.00 in and 10.00 out per 1M, openai/gpt-5.6 at 4.00 in and 20.00 out per 1M, google/gemini-3.6-flash at 1.50 in and 7.50 out per 1M, along with models such as deepseek/deepseek-v4-flash, moonshot/kimi-k3, and qwen/qwen3.8-max. Where several providers serve the same open-weight model, the catalog shows each provider and its price. Overall, Hopscotch works as a routing and billing layer in front of model providers. You change three settings in your existing code: the base URL, your API key, and the model name, which starts with the provider, such as anthropic/claude-sonnet-5. The rest of your OpenAI SDK code stays the same. Requests arrive at https://api.hopscotchlabs.ai/v1, Hopscotch checks them against your limits, sends them to the named model, follows your routing profile if something fails, and records the outcome. You pay each provider's list price per token, with no markup and no added fees. This combination of a stable interface, explicit routing, and enforced limits is what the product presents as its approach: the model layer becomes something you configure and meter rather than a set of connections you maintain. The benefits follow directly from those capabilities. Teams get access to 500+ models without managing a separate integration, account, or bill for each provider. Costs become controllable because limits are enforced before a request reaches a provider, and visibility is central because spend can be broken down by model, provider, key, and teammate. Reliability improves through retries, fallbacks, and backup providers. Switching models becomes a one-line change, which reduces lock-in and makes experimentation cheaper and faster. And because prompts and responses are not stored by default, teams keep their existing data posture. For anyone running AI features in production, these outcomes mean fewer surprises in the bill and fewer integration projects when the model landscape changes. Concrete scenarios from the content include production applications that need per-key budgets so a runaway agent loop cannot drain the balance, and workspaces where an owner can pause all spending at once. Another is comparison: running one prompt on up to three models in the playground, checking the answers and the cost of each, and only then changing the model name in code. Another is reliability engineering, where a routing profile such as Sonnet first, then GPT, then Gemini keeps a service answering when a provider has an outage or returns a 429. Teams can also separate staging and production traffic with different keys and different limits, and developers who already have a provider key can route some traffic through it while other traffic runs on Hopscotch credit. Hopscotch is aimed at developers and engineering teams building AI features, plus the people who own the AI budget inside those teams, since limits can be assigned per key, per teammate, and per workspace. The technical surface is an OpenAI-SDK-compatible REST API at https://api.hopscotchlabs.ai/v1 with chat completions and Responses endpoints and a models endpoint; the examples in the content use Python and curl. Payment is prepaid credit added by card, starting at $5, with optional auto top-up that refills the balance when it drops below an amount you choose. There are no plans or subscriptions, and no token markup. A Product Hunt promotion offered the first 250 Product Hunt users who signed up $50 in free model credits, redeemed with the code HOPSCOTCH50OFF in the Billing tab. In short, Hopscotch positions itself as the intelligence layer for AI: one API, one key, and one balance for 500+ models, with named models, routing profiles, per-key and per-workspace spend limits, and a complete record of what every request cost. For teams that want the best available models without a separate integration, account, and bill for each provider, that combination of access and control is the core value.
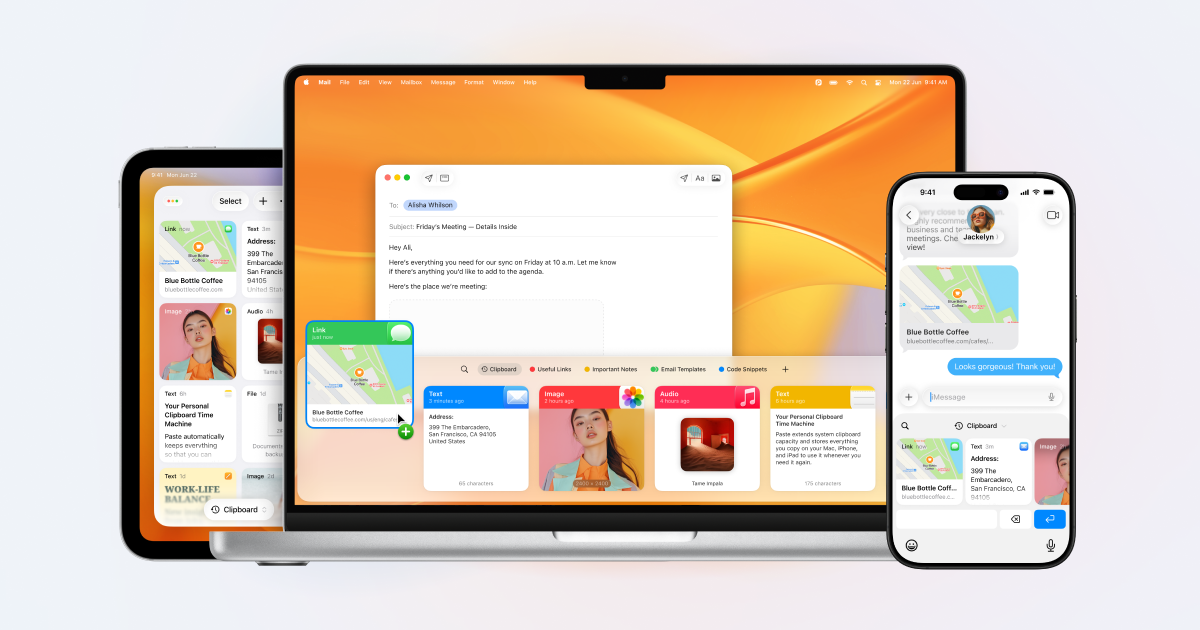
Paste is a clipboard manager for Mac, iPhone, and iPad that remembers everything you copy and keeps it organized, searchable, and in sync across your devices. Anything you copied, on any of those devices, is back in seconds. It is made for people who constantly move snippets, links, images, files, colors, and templates between apps — developers, designers, writers, and teams — and who need that material to be instantly retrievable instead of disappearing the moment something new is copied. Paste describes itself as more than a clipboard: it also suggests what you will most likely paste next based on what you are working on, and it can connect your clipboard history to the AI tools you already use. The default clipboard on any operating system is a single slot. It holds exactly one thing, and the moment you copy something else, the previous item is gone with no way to get it back. That is fine until the moment it isn't: a paragraph you forgot to paste back, a link you copied ten minutes ago, a color value, an address, or a code snippet that took time to assemble. This single-slot behavior forces people to juggle apps, retype text, re-copy the same things over and over, and lose work they had already done. Paste exists to remove that friction. It treats the clipboard not as a temporary holding area but as a persistent, searchable memory of everything you have copied, so the cost of copying something new is no longer the loss of everything you copied before. The first thing Paste changes is the assumption that copied content is disposable. Everything you copy is saved, with no limit, and it stays there — an hour ago or a year ago, it is still in your history. Because an unlimited history is only useful if you can navigate it, Paste also lets you search your whole clipboard history and find what you need in seconds. Instead of scrolling back through dozens of entries, you type what you remember about the item and jump straight to it. Reviewers have noted that the visual nature of the app makes it quick to identify the item you want to paste, and that Paste can be the clipboard star around which your devices orbit. For the things you reach for constantly, Paste lets you pin the snippets, links, colors, and templates you use all the time, so reusable material sits close at hand rather than buried in history. Pinning turns frequently pasted material into a stable shelf: a signature block, a set of brand colors, a boilerplate reply, a template paragraph, an icon, or a link you send repeatedly. Paste is also built to follow you: your clipboard history syncs across Mac, iPhone, and iPad, so an item copied on one device is available on the others. Teams can go further and share pinboards to keep their team in sync, giving a group a common set of snippets and references instead of scattering them across individual inboxes and documents. In Paste, Intelligent Clipboard adds a predictive layer. Paste suggests which of your copied items you will most likely paste next, based on what you are working on. The feature is powered by Apple Intelligence and runs privately on your Mac, so the suggestion is generated locally rather than in the cloud. A separate capability takes the clipboard into AI: Paste connects your clipboard history to Claude, Codex, Cursor, and other AI tools so they can use what you have already copied as context. The connection runs on your Mac, and you choose what to share, which means your history becomes an input to your AI workflows without leaving your control. Paste's overall approach is local-first and permission-based. Your clipboard stays on your device and in your private iCloud; according to Paste, it never touches the company's servers. You can set rules so Paste ignores passwords and other sensitive apps, which keeps credentials out of your history while everything else continues to be captured. The Intelligent Clipboard suggestions are generated by Apple Intelligence on the Mac, and the connection to AI tools also runs on the Mac with you deciding what is shared. Taken together, the design is a clipboard that is expansive in what it remembers and conservative in where that memory travels — the opposite of the usual trade-off between convenience and privacy, and the reason the app describes itself as private by design. The outcome Paste promises is simple: nothing you copy is lost, and nothing you have copied is hard to find. Instead of remembering to paste something before it is overwritten, you can copy freely and retrieve later. Instead of retyping a paragraph, you search for it. Instead of losing an important item because you copied something else, you have both. Developers keep code snippets saved and organized, designers keep colors, icons, and links a keystroke away, writers never lose a paragraph they forgot to paste back, and teams stay aligned through shared pinboards. Users describe Paste as core to their everyday workflows, with some saying it makes them crazy efficient and provides them with superpowers in daily computer use, while others treat it as a must-have Mac app they use dozens if not hundreds of times a day. Concrete workflows show up throughout Paste's own examples. A developer copies one snippet and then the next without losing the first, because everything stays saved and organized. A designer keeps colors, icons, and links a keystroke away while working. A writer drafts a long document and never loses a paragraph that was copied but not yet pasted back. In a messaging or email scenario, someone writing 'Here's the cabin:' finds the copied cabin link already surfaced at the front of the row, because Paste predicted it as the next item to paste. In an AI workflow, a user can ask a tool to find the notes they copied earlier that day in Paste and draft a team update for a launch using them. Teams share pinboards so everyone pulls from the same set of snippets and stays in sync. Paste is aimed at Mac, iPhone, and iPad users, and explicitly at developers, designers, writers, and teams. Its integrations extend to AI tools including Claude, Codex, and Cursor, and its predictive feature relies on Apple Intelligence running on the Mac. Sync is handled through the user's private iCloud, and the app's privacy controls let you exclude passwords and sensitive apps from capture. Paste has been on the App Store for ten years and holds a 4.5 rating from more than 16,000 ratings. Pricing is presented through plans and a purchase option, and the site offers a free seven-day trial of the one app for Mac, iPhone, and iPad, alongside 'Try for free' and 'See plans' links and a direct 'Buy now' option. Paste's value proposition is that the clipboard should remember everything and you should never have to worry about what is on it. By saving every item with no limit, making the whole history searchable, letting you pin what you reuse, syncing across Mac, iPhone, and iPad, and keeping the whole system private on your device and in your private iCloud, it turns a single-slot utility into a durable, searchable memory. Intelligent Clipboard adds prediction on top of that memory, powered by Apple Intelligence on the Mac, and the AI connections let that memory feed the tools you already work in. The result is a clipboard manager that is both broader and more careful than the system default.
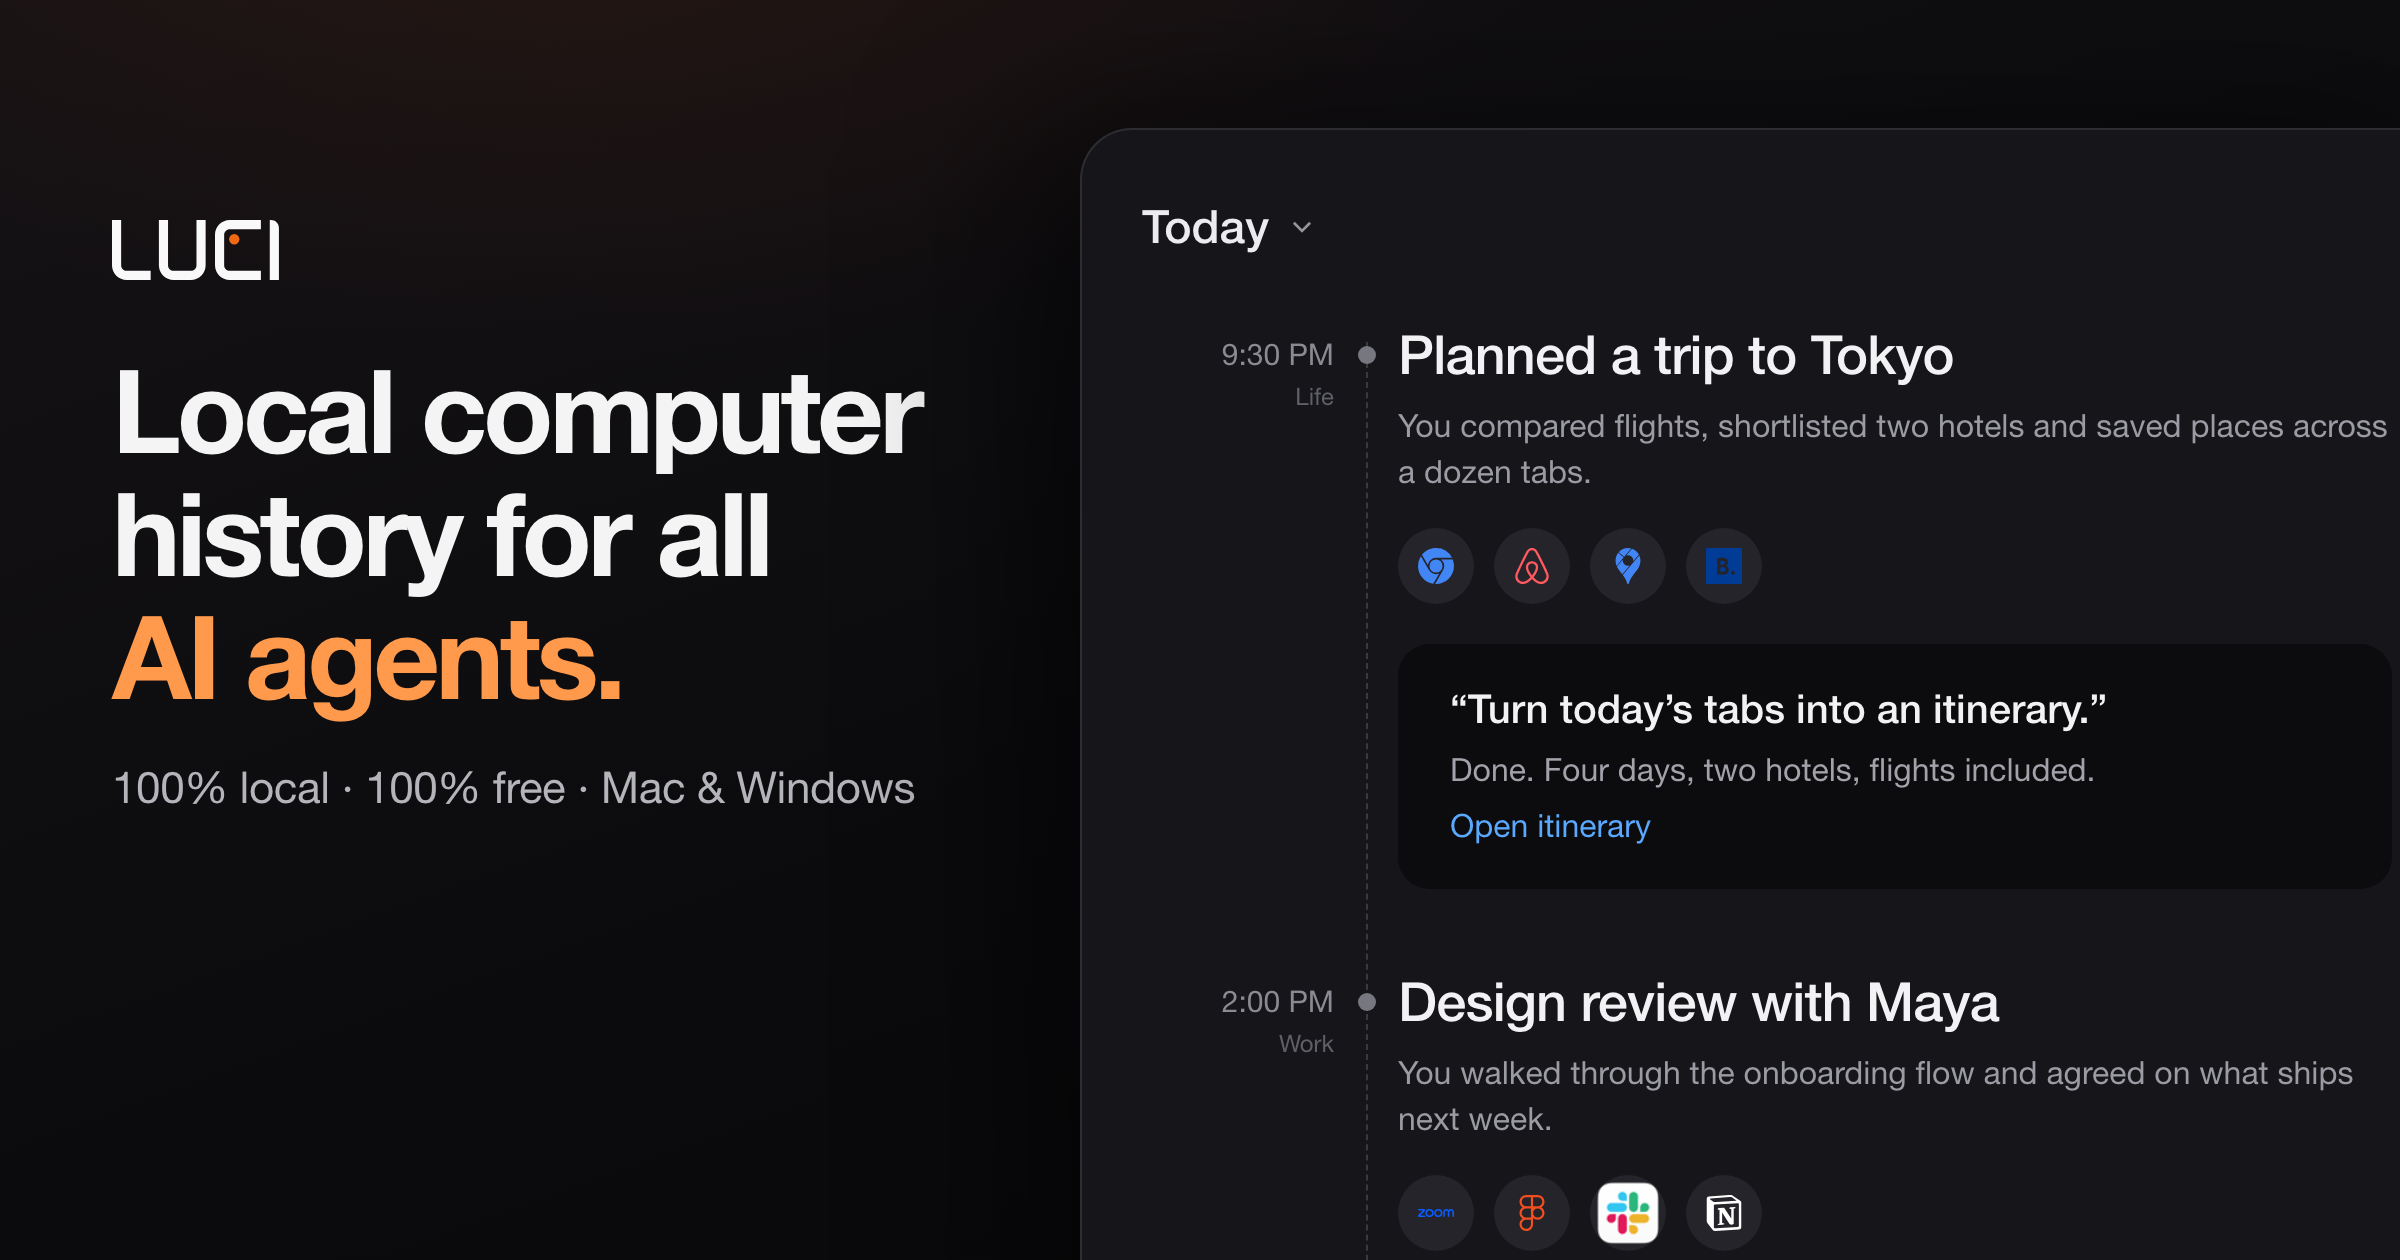
LUCI is a desktop memory layer for your computer. It remembers your whole day — meetings, code, email, and everything in between — and makes that memory available to the AI agents you already run, including Claude Code, Cursor, Codex, and Gemini. Instead of re-explaining what you were doing every time you ask an agent for help, you get one memory across everything you touch. LUCI is free, runs on Mac and Windows, and is built for anyone whose day does not fit in a chat window: developers, founders, researchers, consultants, designers, and support and operations teams. Everything it remembers is processed and stored on your own machine. The problem LUCI exists to solve is context loss. AI agents are powerful inside a single session, but they start each new conversation without any idea of what you were looking at five minutes ago, what was decided on a call this morning, or which file you were reading last week. The usual workaround is to copy, paste, and explain — dropping error traces and design specs into an editor, or reconstructing decisions from scattered calls and threads. Connector-based tools only deepen the problem: they require OAuth, API keys, and per-app configuration, and they still miss internal tools and private documents. Context windows reset between sessions, so the knowledge you build up evaporates. LUCI's answer is to remember on your behalf, locally, and then hand that memory to whichever agent you ask. LUCI's first capability group is capture and chronology. LUCI reads directly from your screen and your calls, which means there are no OAuth flows, no API keys, and nothing to configure: every app you open is already supported, including internal tools and private documents that connectors cannot reach. Chrome, Gmail, Slack, Notion, Linear, Figma, Zoom, Google Meet, Microsoft Teams, YouTube, Discord, and coding agents such as Codex, Cline, Amp, and opencode all fall inside the same record. Because capture is continuous, chronology emerges naturally: your day is laid out end to end, so you can walk back to any moment instead of trying to remember it. Day reports show the shape of that day — active capture hours, sample counts, and the time blocks where work actually happened — alongside the meetings, people, projects, organizations, and rules attached to it. Visual memory is the second piece. LUCI reads and understands what is on your screen on your device, and keeps it findable afterwards. You do not have to have bookmarked a page or saved a file: if you saw it, LUCI can bring it back. Search and insights sit on top of that record. You can ask in plain English across both screen content and meetings — describing something the way you would to a colleague — and answer questions not only about what you saw but about where the day actually went. That combination turns scattered fragments of a working day into something queryable. The third group covers meetings and written output. Voice and transcripts capture every word — yours and theirs — in meetings and calls, with on-device transcription, attached to the day it happened. That means you never take manual notes, and the record of a call sits alongside the screens you were looking at while it happened. From there, distillation takes over: your agent turns the raw day into a short written record and files it in your Life folder. Daily summaries are produced with Microsoft Foundry Local. The Life folder is plain files in a folder rather than a proprietary silo — a record that outlives any single app, including LUCI itself. The fourth group is the local model and privacy layer. Local models — Phi, Qwen, Llama, and DeepSeek — power the understanding of your day; you pick one, switch whenever you like, and your memory stays exactly where it is. Zero-leak redaction runs before anything is saved: cards, keys, and passwords are blacked out so secrets never enter the record. Everything LUCI remembers lives on your machine encrypted at rest, with no cloud copy, and retention is yours to set — keep a week, keep a year, and deleting a day removes it entirely. Agent Bridge ties this to the agents: LUCI connects itself to Claude Code, Cursor, Codex, Gemini, Copilot, Windsurf, Zed, opencode, Amp, Cline, Kilo Code, Warp, VS Code, and Grok, with nothing to set up and no per-agent configuration to keep in sync. Overall, LUCI works by moving memory out of the session and into your machine. Rather than building a connector for every tool, it reads from the screen and the microphone, so coverage is universal by construction. On-device understanding converts that raw material into something structured: days, transcripts, and distilled reports. Then Agent Bridge exposes it to your agents, which query LUCI instead of asking you to re-explain. Add a new agent tomorrow and your memory is already there. The result is a single, persistent, private record that any assistant can draw on. The benefits show up in the small frictions that disappear. A staff engineer stops copy-pasting error traces and Figma specs into Cursor, because the agent queries LUCI for what was on screen five minutes ago and gets straight to work. A head of product no longer spends Friday afternoons reconstructing decisions from scattered calls and threads, because the week is distilled into the project log in seconds. A founder ends each evening with an honest summary of where the time actually went. A principal AI engineer can recall why a specific architecture pattern was chosen three weeks ago, even though context windows reset between sessions. A solutions director gets every client call captured and organized without manual notes, so a proposal draft can pull the exact constraints the client mentioned. And for security teams, redaction plus local indexing makes sign-off frictionless — LUCI is GDPR compliant and SOC 2 Type 2 certified. The use cases LUCI highlights are the things you would ask on day one. Ask about your screen: whatever is in front of you becomes answerable, so you can resolve 'this' and 'that' across sessions and jump straight to the right source. Catch up on a call: every word, yours and theirs, is captured without you taking notes. Recap your week: your agent distills the day into plain files in your Life folder, giving an honest picture of where the week went. Search what you saw: describe a reference you scrolled past on Tuesday and find it again on Friday — a page you forgot to bookmark, a decision from a call, a half-remembered document still findable weeks later. LUCI is built for developers, founders, researchers, consultants, designers, and support and operations teams — anyone who would rather not copy, paste, and explain what they were doing every time they ask an agent for help. It runs on Mac and Windows, and it is free and fully local. Supported agents include Claude Code, Cursor, Codex, Gemini, Copilot, Windsurf, Zed, opencode, Amp, Cline, Kilo Code, Warp, VS Code, and Grok, with any agent you install next expected to connect through the same bridge. Data lives encrypted on your disk, on-device understanding keeps processing local, and your Life folder is plain files you control. LUCI's core promise is simple: your whole day on the computer, remembered on your machine, and handed to whichever agent you ask. It removes the work of carrying context between sessions while keeping the memory yours — local, redacted, encrypted, and portable as plain files.
ZergRouter is a routing service built for people who use coding agents and want to keep their existing tools while choosing which models power them. It presents one OpenAI-compatible endpoint that connects supported clients, so tools that speak the OpenAI protocol can point at ZergRouter rather than being tied to a single model provider. The product's stated promise is simple: keep your coding tools, and choose your models. With ZergRouter you can run DeepSeek in Codex, connect compatible apps through one Router endpoint, set daily budgets for API keys, and see quotas and reset times across your connected Codex accounts. It is aimed at developers and individual users of coding agents such as Codex, Pi, OpenCode, or terminal-native environments, and it gives them a single place to manage routing policy, access, and spend instead of configuring each tool separately. The problem ZergRouter addresses is the fragmentation that appears once you start using more than one model provider and more than one coding account. Normally the routing policy — which model to use, what limits apply, and what happens when a provider fails — lives inside each individual tool, duplicated and drifting out of sync. ZergRouter moves that policy into your account instead; the Product Hunt description states plainly that the routing policy lives in your account, not inside each tool. That matters because developers may work with multiple Codex accounts, each with its own weekly quota and reset schedule, and they may want to try different models such as DeepSeek without abandoning the workflow they already have. Managing budgets per API key, tracking when quota data was last updated, and knowing whether an account has banked resets are all awkward to do by hand. ZergRouter centralizes these concerns behind one endpoint, so the tool you already use stays the same while routing, budgeting, and monitoring happen in one account-level layer. The first core capability is routing. ZergRouter provides one endpoint for your tools. You use provider API credentials together with scoped Router keys, choose models, set limits, and configure explicit fallback chains for supported chat requests. The flow shown on the site is a client sending requests to https://zergrouter.com/v1, which then routes to a model. A Router key connects supported clients, and model availability depends on credentials, permissions, and protocol support. Explicit fallbacks mean that on a 5xx error, a 429 rate-limit response, or a timeout, the system can try your next model rather than simply failing. This is useful because provider errors can otherwise interrupt a request; with an explicit fallback chain that you have already approved, the next model in line is attempted instead. The documentation covers routing behavior in detail, and the site notes that the authenticated catalog is the authority for which models are available to you, so you can check before connecting a client. The second capability group is Codex capacity monitoring. ZergRouter lets you see your Codex capacity by comparing accounts by remaining weekly quotas, each quota's reset date, and banked resets. Stale data stays clearly marked, which means you are told when quota information was last updated rather than being shown a misleading number. API keys and personal subscriptions are separate access paths; a Router API key authenticates routed requests, while provider credentials and Codex subscriptions remain separate. The FAQ makes this explicit: a Router key does not include a model subscription. The value here is decision-making. ZergRouter does not switch your local Codex account automatically; you choose the account for a local Codex session. What the router provides is visibility — quotas and reset times — so that you can decide which account to use. For developers who maintain several accounts to spread load or to keep working when one quota runs dry, having remaining weekly quotas, reset dates, and banked resets in one view removes guesswork and makes account selection deliberate rather than accidental. The third capability group is understanding what ran. ZergRouter lets you explore routed usage by model, by date, and by client. Where providers report them, you can see input, cached input, and output figures. The site is careful about accuracy: account-wide Codex history does not invent missing token breakdowns, and unknown data is labeled as unknown rather than guessed. That approach matters for anyone trying to reconcile what they spent, which client generated the traffic, or which model is driving their token consumption. Because ZergRouter sits between the client and the model, it can aggregate routed usage across the tools you connect — such as Codex, Pi, OpenCode, and other OpenAI-compatible apps — and present it in one place. Rather than relying on each provider's dashboard separately, you get a routed view that distinguishes between input, cached input, and output where that data exists, and clearly marks where it does not. The product's overall approach is a three-part chain: your tool stays the client, ZergRouter is the router, and your chosen model sits behind it. The homepage frames this as keeping the client and choosing the route. A Router key connects supported clients, and requests are sent to the single endpoint at https://zergrouter.com/v1. Model availability depends on your credentials, permissions, and protocol support, and the authenticated catalog is the authority on what you can use. For Codex specifically, the site explains that you can use a model advertised by /v1/models?capability=codex_responses, and that the Modal route supports native Responses forwarding. DeepSeek 4.1 Flash is available as a route. New personal accounts can try it through Modal Shared Endpoints for 14 days after account creation, using a Router key, under a $0.50 UTC-day account-wide trial cap and a 5M-token monthly quota. Other Modal models are not included. Trial access also depends on shared platform capacity and on the Modal endpoint being available, and the site advises checking your authenticated catalog before connecting a client. After the trial, the paid route is metered at $0.30 per 1M input tokens, $0.03 per 1M cached input tokens, and $1.20 per 1M output tokens, up to your monthly usage cap. ZergRouter supports paid usage or bringing your own provider keys, and when you bring your own provider keys they are billed by your provider. The benefits follow directly from those capabilities. Daily budgets for API keys, enforced per request, give you spend control at the key level rather than relying on after-the-fact reporting. Explicit fallback chains reduce the chance that a single provider error stops a request. Quota visibility across connected Codex accounts helps you plan which account to use and when capacity resets. Routed usage by model, date, and client helps you understand where tokens are going. Because the routing policy is stored in your account, changing a model or a limit does not require reconfiguring every tool; you update the policy once. Sign-up and Codex account monitoring are free, so you can evaluate the visibility layer before committing to paid usage. The overall outcome is a coding setup that keeps the tools developers already know while making model choice and spend manageable from one account. Concrete scenarios include running DeepSeek in Codex while keeping your existing Codex workflow, since ZergRouter points the Codex Responses provider at one endpoint. Another is bringing your routed model catalog into the Pi coding agent, or using ZergRouter as an OpenAI-compatible provider in OpenCode. People who use ZTC, a terminal-native coding environment, can connect through the supported client path as well. Developers who already hold provider API keys can bring them and route through one endpoint rather than configuring each tool separately. Anyone maintaining multiple Codex accounts can use the monitoring view to compare remaining weekly quotas, reset dates, and banked resets before choosing which account to use for a local Codex session. A first request is as simple as sending a curl call to https://zergrouter.com/v1/responses with a Router key and a model such as modal/deepseek-v4.1-flash, and the site also provides Python and TypeScript examples for the Router API. ZergRouter is intended for developers and individual users working with coding agents, particularly those who want to choose models independently of the client they use. The integrations and connected tools explicitly listed on the site are ZergAI, Zerg, ZTC, ZDE, Codex, Pi, OpenCode, and OpenAI-compatible apps generally. ZergAI is where you create your Zerg identity and sign in across the stack. Zerg is described as a platform for building and running autonomous software agents, ZTC as a fast terminal-native coding environment, and ZDE as a visual workspace for seeing agent work, files, and execution state. On pricing: creating an account and Codex account monitoring are free. Eligible new personal accounts receive a bounded 14-day DeepSeek trial on platform tokens, subject to the $0.50 UTC-day trial cap and the 5M-token monthly quota. Beyond the trial, DeepSeek on ZergRouter's tokens requires a $5/month plan, metered usage, and a card on file. Your own provider keys are billed by your provider. Access and any billing requirements are confirmed in ZergAI rather than inferred from the marketing page. In short, ZergRouter is an account-level routing layer for coding agents: one OpenAI-compatible endpoint, scoped Router keys with per-key daily budgets, explicit fallback chains, Codex quota visibility, and routed usage analytics. It lets developers keep the tools they already use while choosing the models behind them and keeping spend and capacity in view.
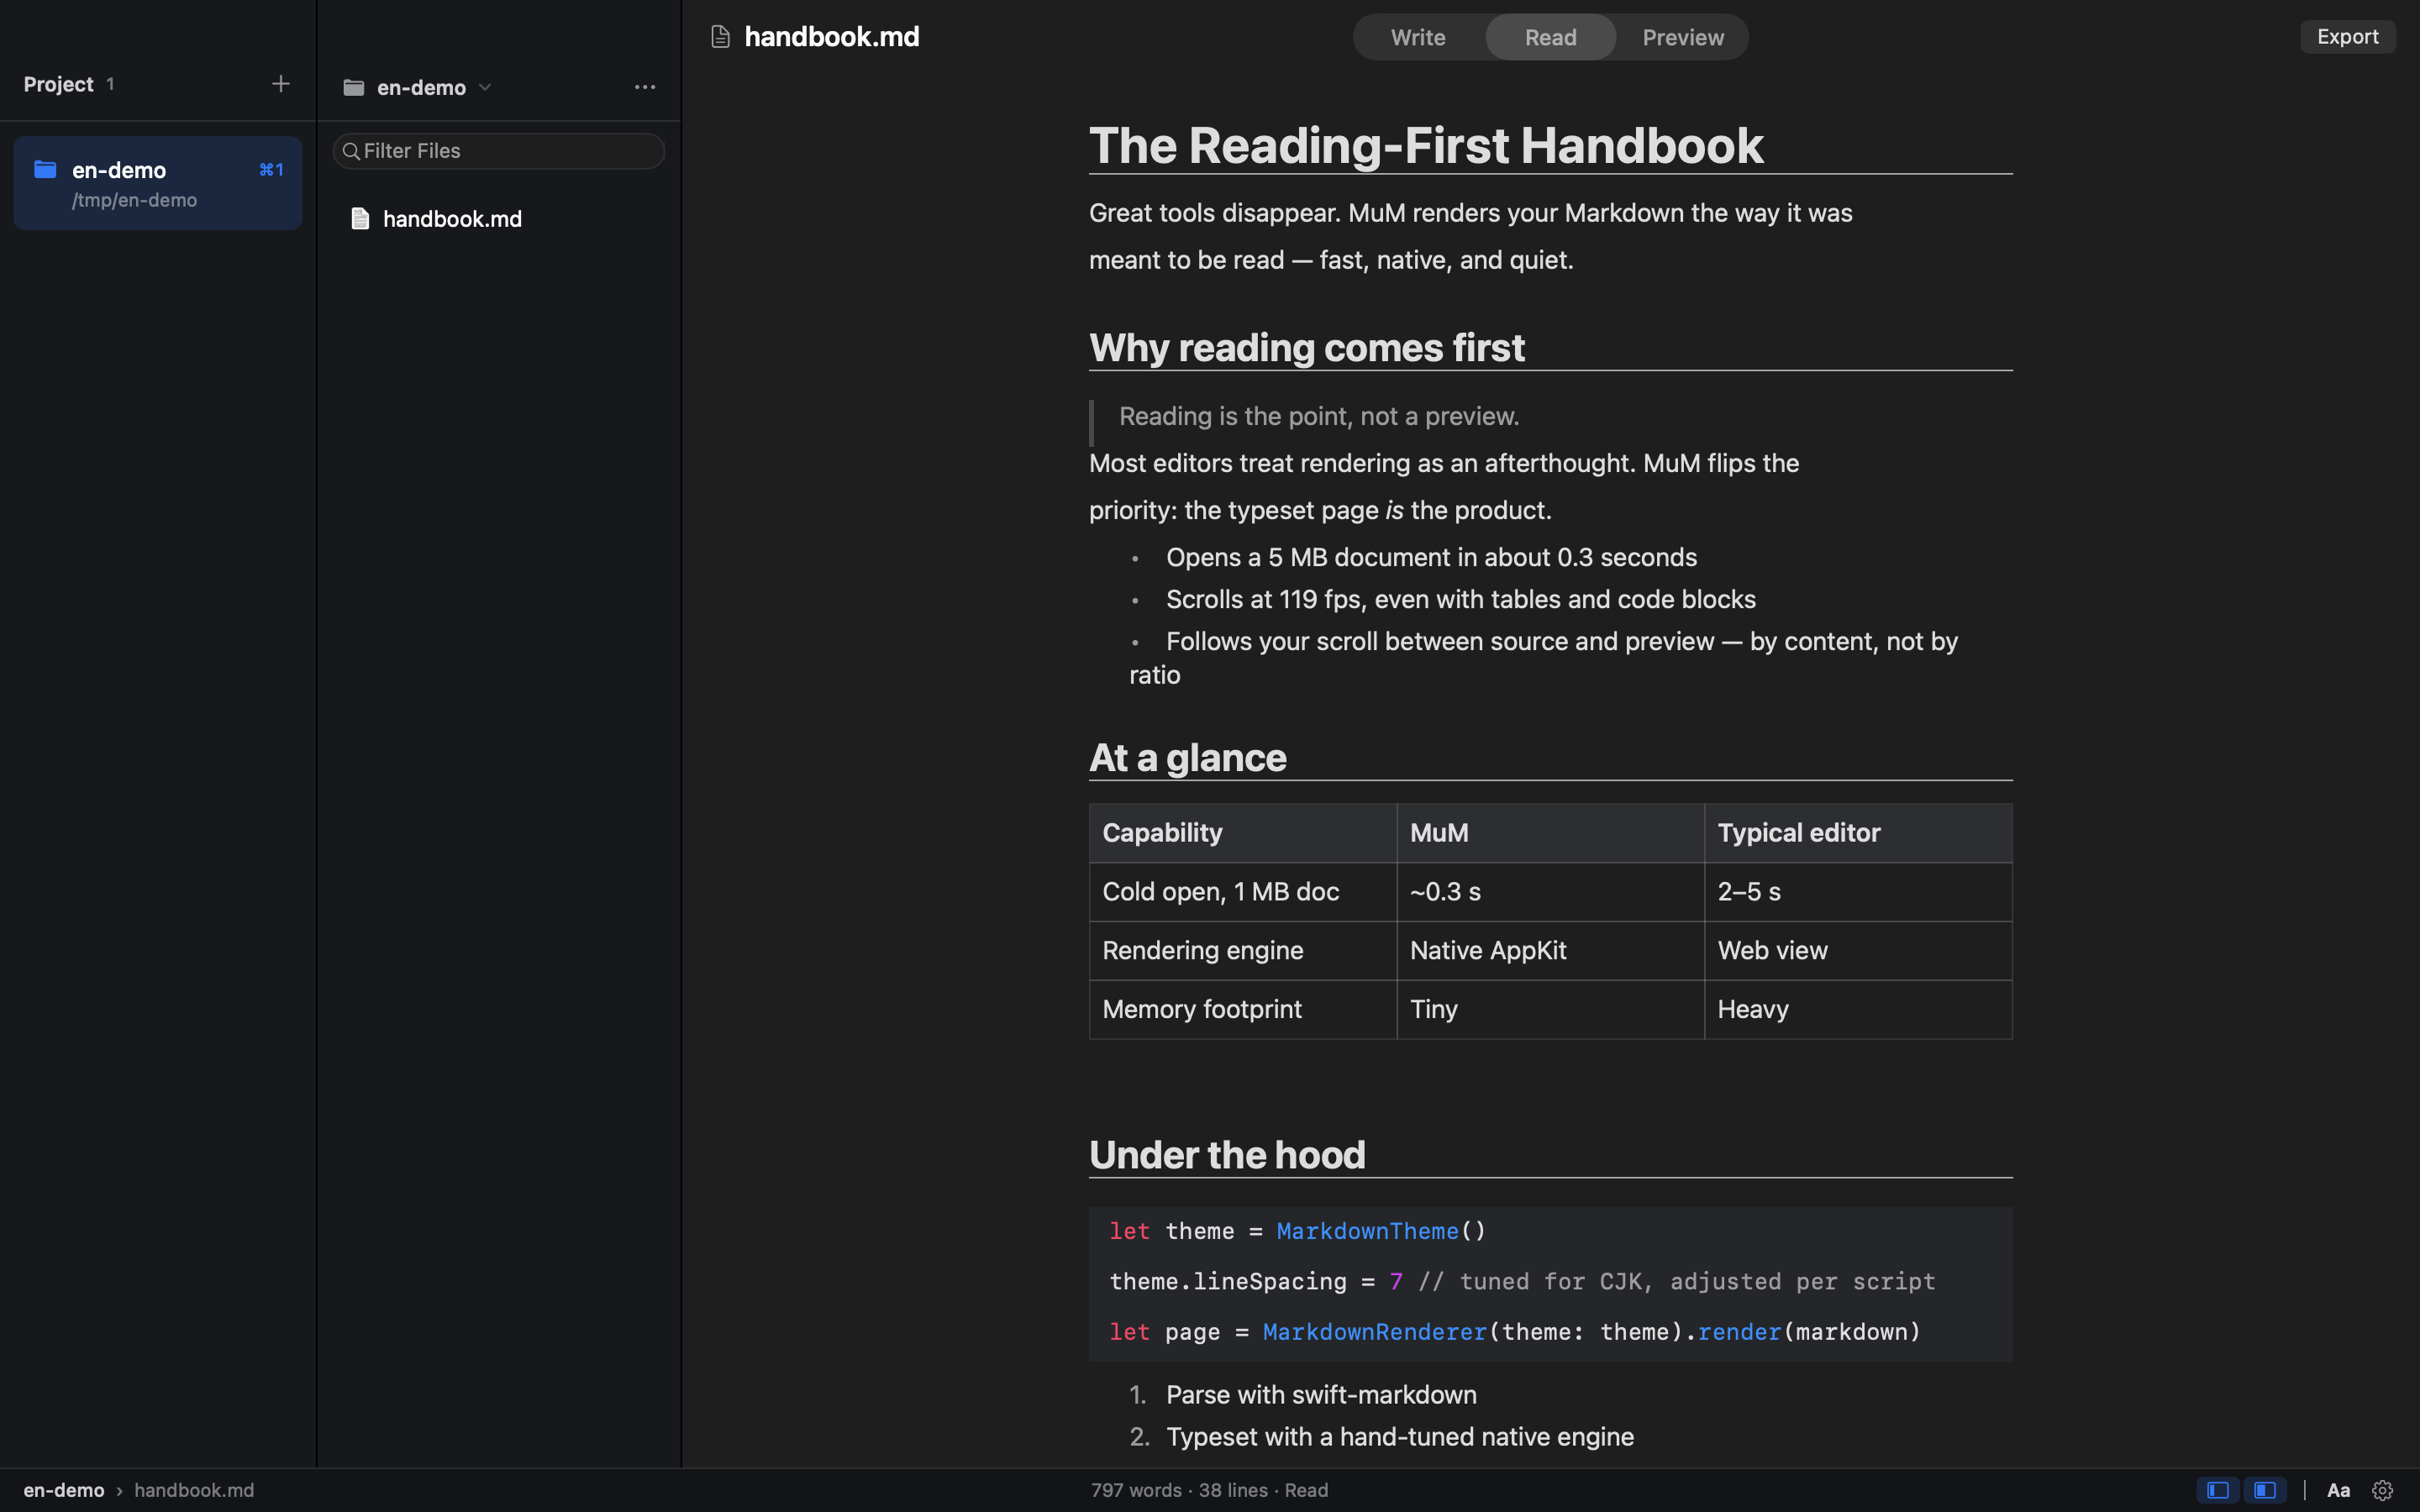
MuM is a reading-first Markdown engine for macOS, described by its makers as a native macOS reader with no web engine inside — everything is built with AppKit. Its og:description sums the product up as hand-built AppKit typesetting for humans and CLI rendering for agents. Instead of being a writing app with a preview pane, MuM is designed for people who already have Markdown scattered across many folders and who simply want to read one section. It opens several projects at once, each remembering where you stopped, and provides cross-project search plus typesetting tuned for CJK as well as Latin text. It is open source under the MIT license, and it also ships a command-line side that renders Markdown for agents. The product's own framing states that your Markdown lives in a dozen folders, and that most of the time you do not want to write — you just want to read one section. Yet, according to MuM, every other Markdown tool is a writing app with a preview pane. That mismatch means readers are pushed into interfaces built around editing, with preview workflows and rendering stacks that add friction to what should be a simple act of reading. MuM addresses this gap by inverting the model: reading comes first, and authoring is not the point. It also targets the practical annoyance of juggling many separate documentation folders by treating each project as an answer to the question of where you are, so context is never lost when you move between documents or repositories. MuM's core human-facing capability is multi-project reading. You can keep several projects open at the same time and switch between them with ⌘1 through ⌘9, and each project remembers where you stopped, so returning to a document resumes at the exact place you left off. The app is explicitly built for reading rather than authoring: ⌘F performs find within a document, ⌘⇧O opens an outline, and reading history is navigated with ⌘[ and ⌘]. Because each project preserves its own position, MuM's projects serve as landmarks that answer where you are, which matters when documentation is spread across many repositories and folders rather than living in one tidy workspace. Finding content is handled by two dedicated shortcuts. ⌘P fuzzy-finds files by name, which is the fast path when you know roughly what a file is called but not which folder holds it. ⌘⇧F goes further, searching names and contents across every project and streaming results as they are found, so you are not limited to the project currently on screen. Together these two modes cover the two most common retrieval patterns — reaching for a known file and hunting for an unknown phrase — without leaving the reader or opening a separate search interface. MuM's typesetting is tuned for CJK as well as Latin text. Line height, punctuation compression, and mixed-script spacing are measured rather than guessed, which is what allows documents that mix Chinese, Japanese, or Korean characters with Latin script to read cleanly instead of looking mechanically assembled. The rendering path is deliberately broad: MuM reads code with syntax highlighting, renders CSV and TSV as tables, and displays RTF, images, PDF, and srt/vtt subtitles. Office files get a page that points you to the default application. Markdown can also carry limited HTML — small, mark, and super/subscript tags render semantically while the tags themselves stay out of sight. Export is built in as well: ⌘⇧E turns the current document into a tall PNG or a paged PDF, and page-break hints written in the document become real page breaks in the output. Day to day, MuM keeps the interface quiet. Double-clicking a lone file opens single-file mode: both sidebars fold away and you simply read, and the folder is not turned into a project, so your project list stays clean. File management lives in the file tree's menu and right-click menus, where ⌘N creates a new file and you can also create folders, rename items, or move them to Trash. One click opens a shell right at a deeply nested folder, auto-detecting Ghostty first, then iTerm, then Terminal.app. Updates are one-click too: a banner's Download update button downloads the DMG in-app, mounts it, and lets you drag MuM into Applications. The app is quiet in a broader sense as well — no accounts, no telemetry, no plugin store — on the principle that a tool shouldn't be louder than its content. Structurally, MuM is the opposite of a writing app with a preview pane. The entire typesetting engine is hand-built and native, and the app contains zero web engines, so rendering happens directly rather than through an embedded browser. That same hand-built engine powers a windowless path for agents: a CLI renders Markdown straight to PNG or PDF with the same CJK spacing, code highlighting, and reading themes used inside the app. Commands such as mum render README.md --png cover.png and mum outline README.md --json let automated consumers get images or structured outlines, and outline, search, and check emit stable JSON with classified exit codes (0, 1, 2, 3, and 4), so agents never have to parse prose. This dual-surface approach — the same engine serving both a macOS window and the command line — is the product's central methodology. The benefits follow from those design choices. Because MuM contains zero web engines, it starts cold to a window in about 0.3 seconds, ships as a 1.7 MB installer, and scrolls a 5 MB document at over 100 fps — figures the product itself publishes. Because projects remember reading positions and history is navigable with ⌘[ and ⌘], you spend less time reorienting and more time reading. Because search spans every project rather than one folder at a time, you are not forced to remember which repository contains a given phrase. And because there are no accounts, no telemetry, and no plugin store, nothing is running in the background or asking for attention beyond the document itself. Concrete scenarios include keeping several documentation projects open at once and hopping between them with ⌘1 through ⌘9 while each holds its place; double-clicking a single Markdown file to read it in single-file mode without polluting your project list; pressing ⌘⇧F to find a phrase whose location you have forgotten across all your projects; exporting a document to a tall PNG for sharing or a paged PDF for printing, with document page-break hints becoming real breaks; reading a deeply nested folder and jumping straight into a shell there through Open in Terminal; and, on the agent side, running the CLI to render README.md to a PNG cover or to emit an outline as JSON so scripts and agents can consume structure rather than prose. MuM is aimed at macOS users who read a lot of Markdown — its topics are Open Source, Developer Tools, and GitHub — and at agents that need rendered or structured output. The app is native, built with AppKit and containing no web engine, and it is open source under the MIT license, so no purchase is required. Integrations mentioned are practical rather than plugin-based: terminal emulators are auto-detected in the order Ghostty, then iTerm, then Terminal.app, and the CLI exposes mum render README.md --png cover.png and mum outline README.md --json, with outline, search, and check emitting stable JSON and classified exit codes (0/1/2/3/4) so that agents never parse prose. MuM's value proposition is simple and self-declared: it is a reading-first Markdown engine. By building everything in AppKit, skipping web engines, remembering where you stopped across several projects, searching every project's file names and contents, tuning typesetting for CJK and Latin alike, exporting to PNG and PDF, and exposing the same engine to agents through a quiet CLI, MuM treats Markdown as something to be read — fast, native, quiet, and open source.
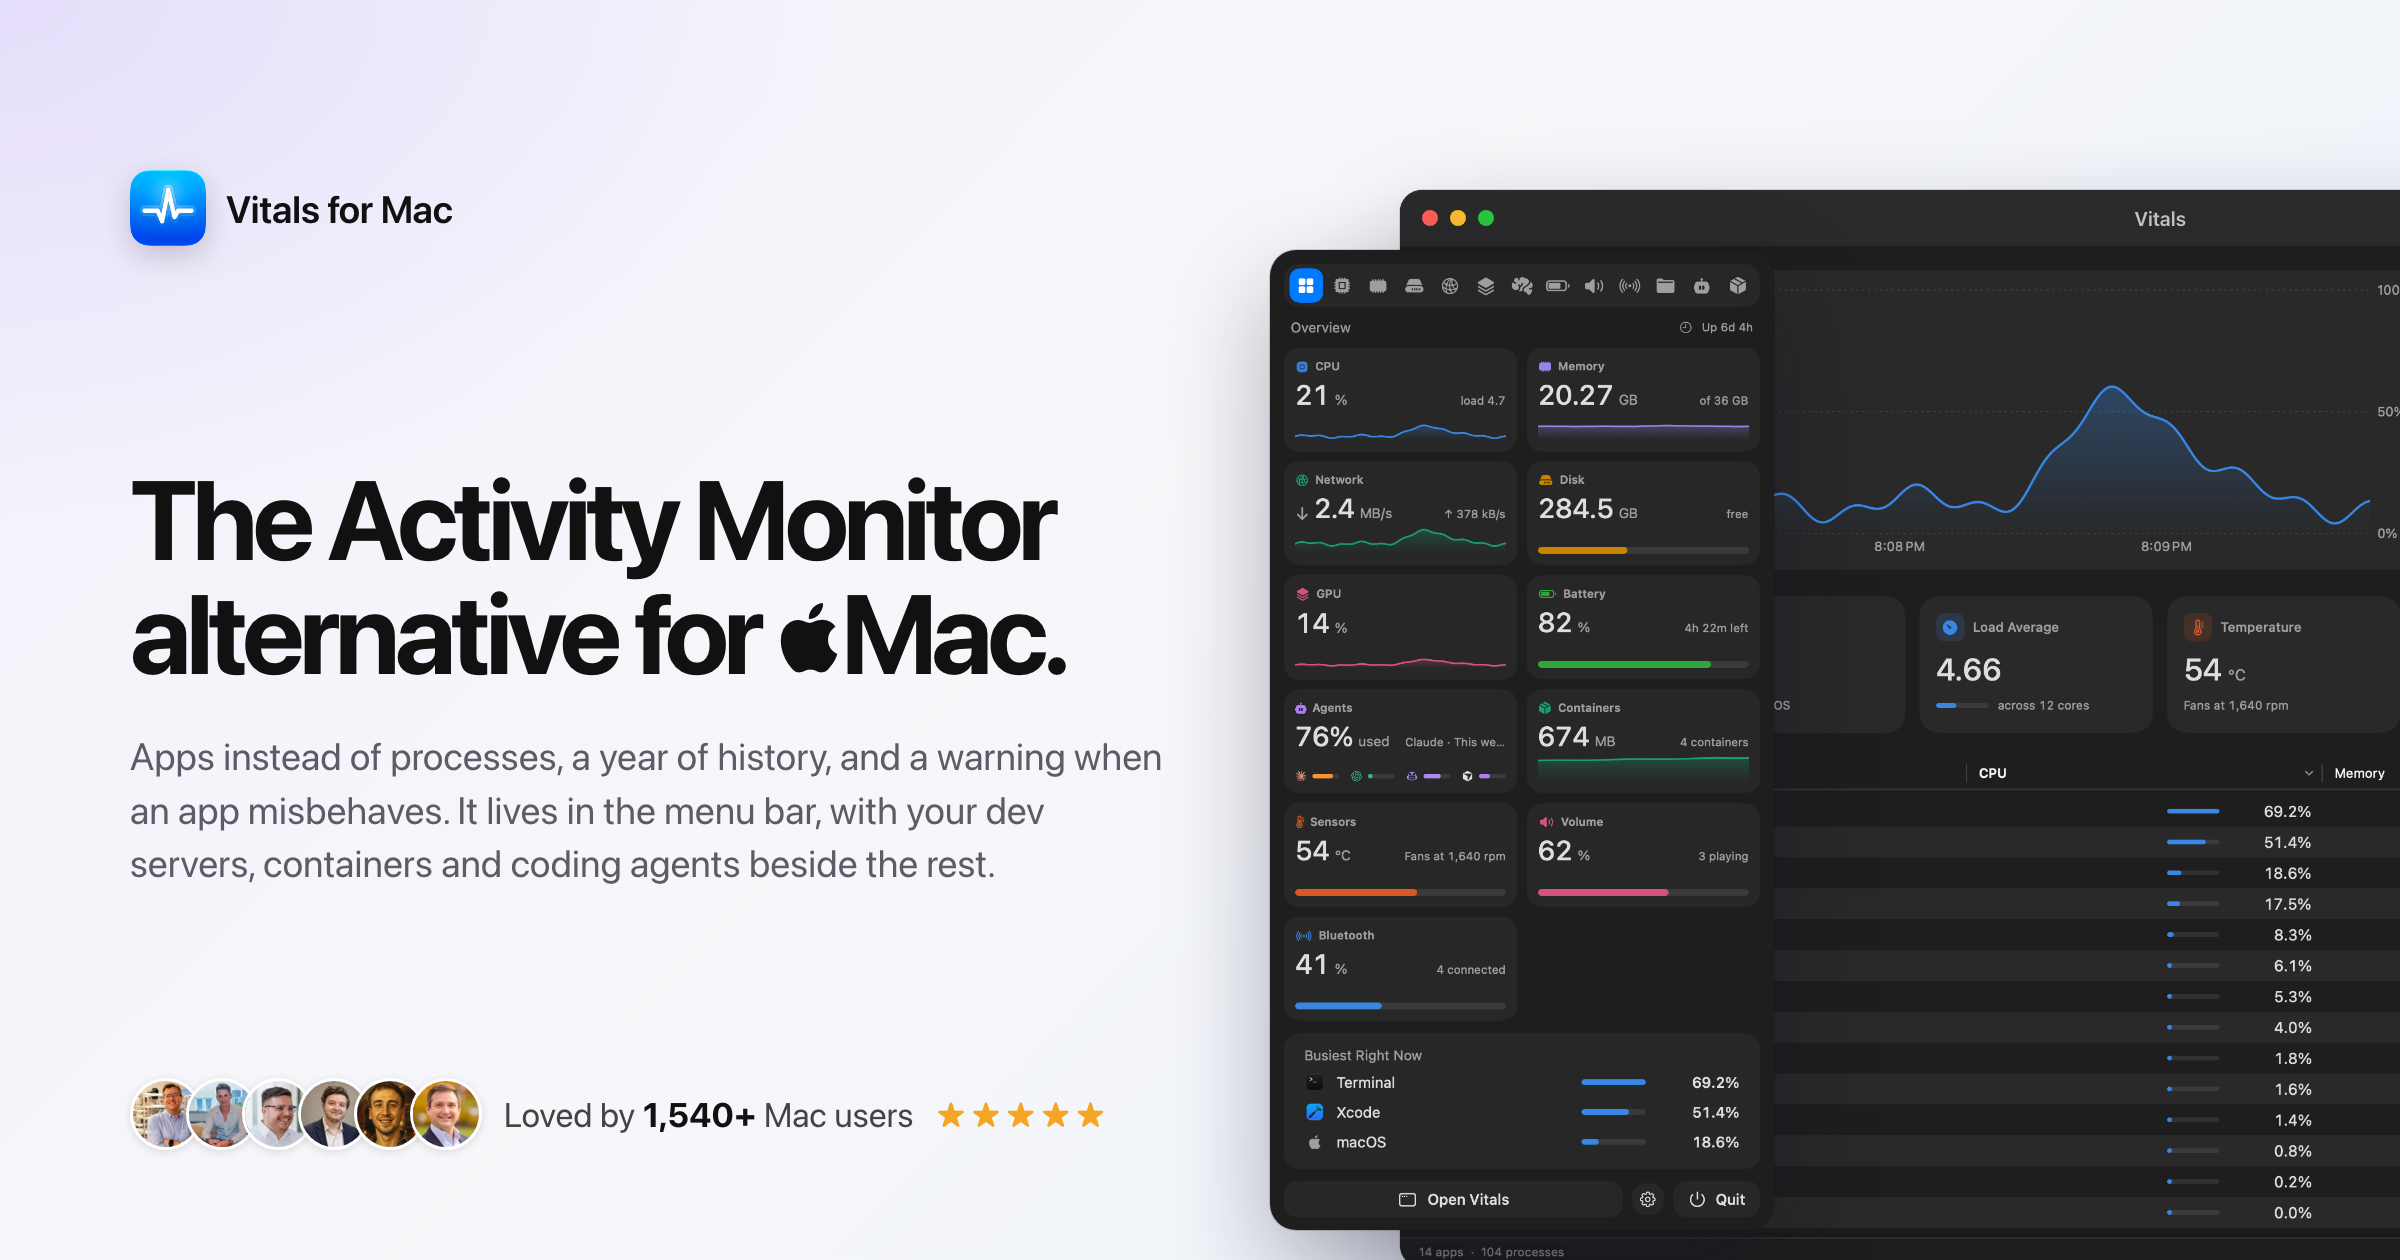
Vitals is an Activity Monitor alternative for Mac that changes how system monitoring is presented: instead of listing roughly 1,000 individual processes, it groups every process under the app that launched it. A working Mac therefore shows about 60 apps instead of 1,000 processes, each with one figure for memory, CPU, energy, disk and network. It is made for Mac users who want a clear, app-level answer to the question 'what is using my memory?'. Vitals keeps 30 days of history, alerts you when an app misbehaves, points out forgotten dev servers, and reports temperatures, fans and battery. Every readout can sit in your menu bar, arranged your way, and it is sold as a one-time purchase. macOS Activity Monitor lists every process on the system. On a working Mac that is about a thousand rows, a hundred of them called Google Chrome Helper, and to work out which application is actually responsible for your memory or CPU use you have to add the helpers up yourself. Vitals frames the difference simply: Activity Monitor is good at showing what is happening this second, while Vitals also tells you which app is responsible, what happened while you were not looking, and when something needs your attention. It adds every helper to the app that launched it, so each app gets one row and one figure. The result is that 'what is using my memory?' has a one-line answer rather than a long list of similarly named processes. The first feature group is app-level monitoring across every major metric. Vitals tracks CPU, memory, GPU, disk, network, energy and battery, and it presents each of those metrics per app rather than per process. In the app there are tabs for Overview, CPU, Memory, Disk, Network, GPU, Battery, Sound, Bluetooth and Projects. A Memory by App view, for example, shows Google Chrome at 21.23 GB, VS Code at 8.17 GB, Terminal at 3.86 GB and Safari at 2.69 GB, with the remainder grouped under Other. The same per-app breakdown exists for CPU, disk writes, downloads, GPU use and power draw, so a heavy video call, a runaway browser tab or a rendering job can be traced back to the application that owns it instead of to a helper process. The second group is history and alerting. Vitals keeps 30 days of history for every metric, per app, selectable as the last 12 hours, 24 hours, 7 days or 30 days, together with which apps used the most. The data is stored in one small file on your Mac. On top of that, Vitals sends alerts when an app misbehaves: a notification when an app hogs the CPU, keeps growing in memory, or hammers the disk or network. The website illustrates this with a Slack alert noting memory up 1.4 GB in an hour, now 3.3 GB, and a Chrome alert showing 70% CPU on average for ten minutes. Activity Monitor offers live graphs and 12 hours for energy but no alerts, so this is where Vitals adds ongoing awareness rather than a single snapshot. The third group is the menu bar experience. Every readout can be its own menu bar item, covering CPU, memory, GPU, network, disk, temperature or battery, shown as a value, a graph or both, with or without its icon. Holding the Command key lets you drag the items into any order, and the icon turns into a warning sign when your Mac is under strain. Clicking an item opens a dropdown containing every metric on one screen, the busiest apps right now, and a tab for each metric with the apps behind the figure. You can arrange its tiles or switch to a list with one line per metric, and clicking an app opens a window focused on it. Activity Monitor itself has no menu bar presence; at most its Dock icon can show CPU use, which is what Vitals is intended to replace. The fourth group covers dev servers and open ports. Vitals groups processes by the project folder they run in and shows the ports they have open. It points out a dev server that has done nothing for three days and offers to stop it, and it asks before it stops anything. The website shows an example list with servers on ports 4322, 8000, 4321, 3000 and 5173, labelled with their runtime (node or python) and how long they have been idle or up, with buttons to stop them. A confirmation message reports that storefront-web stopped, freeing 458 MB and port 4322. Activity Monitor has no equivalent, so leaked node processes and forgotten ports have to be hunted down by hand without it. Beyond those four groups, Vitals includes eight smaller features. Alerts for misbehaving apps, described above, sit alongside per-app volume control so you can turn a meeting up and music down, with nothing recorded. There are temperatures, fans and batteries: CPU and GPU temperature, fan speed, and the battery level in your AirPods, mouse and keyboard (the site shows AirPods Pro left at 42%, right at 58%, case at 80%, plus a Magic Trackpad and Magic Keyboard). You can quit an app or a single process from any list, with Vitals always asking first, and the confirmation warns that quitting Google Chrome will close 96 processes. You can export a 1200 by 630 share card of your memory, top apps and CPU, or copy the whole dashboard, in light or dark. Arrange everything lets you choose the tabs and show, hide and reorder sections, including the dropdown tiles and menu bar items, with a reset. Units you choose covers Celsius or Fahrenheit, bytes or bits, and CPU per core or per Mac. A distinctive part of the product is its privacy posture. An activity monitor sees every app you run and every project you work on, and Vitals keeps all of it on your machine. There is no account: you buy a license key and there is nothing to sign in to. There is no analytics, so Vitals does not report what you run, when, or for how long. The only two network requests are one that checks for updates and one that checks your license. History storage is one small file on your Mac. For developers working on private codebases and for anyone who objects to telemetry in a system tool, that architecture is the point rather than a footnote. The overall approach is a grouping layer on top of the process data macOS already exposes. Vitals adds each helper process to the app that launched it, so fifty or a hundred child processes collapse into one row, one figure and one history line. That same grouping is reused across tabs: per-app memory, per-app CPU, per-app disk writes, per-app network, per-app GPU and per-app power all derive from the same app identity. Grouping by project folder extends the idea to running servers, which is why idle dev servers and their ports can be surfaced and stopped. Because the app is native to the machine, the figures come from your own Mac; the interactive demo on the website uses simulated figures precisely because a web page cannot read your Mac and should not. The outcome for users is a faster answer to ordinary questions: which app is actually using the memory, what happened overnight, and whether something is heading in the wrong direction. Reviews quoted on the site describe the experience in similar terms: users say they find themselves glancing at the menu bar instead of worrying, that Activity Monitor is horrible when juggling dev projects and local AI, that having CPU, memory, GPU and projects in one place is a game changer, and that Vitals is a fast, well-designed upgrade that finally answers questions they had been searching for an app to solve. Paying once and owning the license, with every update included for life, is framed as part of the value. Concrete workflows described on the site include identifying which browser or app is responsible for memory pressure, as in the reviewer who discovered Dia was using most of their memory; watching what happened while you were away using the 12-hour, 24-hour, 7-day and 30-day history views; cleaning up leaked node processes and idle dev servers holding ports 3000, 4321, 4322, 8000 and 5173; receiving alerts when an app hogs CPU, grows in memory or hammers disk and network; checking CPU and GPU temperature, fan speed and accessory battery levels; controlling volume per app during a call; and exporting or copying a dashboard image for a post or a support thread. Vitals is aimed at Mac users who want more than Activity Monitor, particularly developers and AI builders running local projects and servers, and people who currently use menu bar monitors such as MenuMeters, iStat Menus or Stats, or who are arriving from Windows Task Manager. It is a Mac app sold at vitalsmac.com, with a waitlist open for Windows. Pricing is one-time: $9 during the launch, rising in steps to $29 as licenses sell, with no subscription. The site notes 1,000 licenses sold at $5 and 96 of 100 left at $9, one key per paid Mac that can be moved at any time, a 14-day refund, and every feature and update for life. Vitals reframes Mac system monitoring around apps rather than processes. By folding every helper into the app that launched it, keeping 30 days of per-app history, alerting when an app misbehaves, surfacing forgotten dev servers and putting configurable readouts in the menu bar, it aims to answer what is using your Mac in one line. Add local-only data, no account and no analytics, and a single one-time price, and the promise is a simpler, private, faster way to understand what your Mac is doing.
ShipWithMuse is a curated directory of what people are building with Meta Muse. The site describes itself as "a catalog of what people build with Muse," and its Product Hunt tagline is "Discover what people are building with Muse." Rather than publishing its own tutorials or demos, it collects real builds from around the web — agents, connectors, apps, games, skills, resources and local Glimmer runs — and presents them in one searchable catalog. Every entry is linked back to its original public source, whether that is an X post, a Reddit thread, a GitHub repository, a YouTube video, a blog resource or a website. It is built for developers, builders and curious observers who want to see the concrete things people have made with Muse rather than read abstract descriptions of the platform. The problem ShipWithMuse addresses is dispersion. Builds made with Meta Muse appear in many different places: developers post screenshots and results on X, hobbyists share custom connectors on the r/MuseAgent subreddit, engineers publish repositories on GitHub, video creators walk through results on YouTube, and writers publish guides and benchmark analyses on their own blogs. Following all of those channels individually is impractical, and much of the work is easy to miss. ShipWithMuse aggregates that material into a single catalog of more than 1,000 builds — the homepage header reads "1079 usecases built now with Muse" — so that anyone evaluating the platform can see what is actually being shipped in practice rather than relying on marketing claims. Because the entries link to their sources, the directory doubles as an index of evidence: benchmarks, demos, repositories and how-to guides that can be checked firsthand. Browsing is organised around build type and page. The catalog lists all 1,079 builds, then offers type filters with their own counts: X posts (462), Reddit posts (124), GitHub (143), Videos (61), Sites (33), Skills (110), Resources (137) and Guides (9). A separate "Star picks" toggle lets visitors show only the curated highlights. Results are paginated — the full catalog spans 27 pages — and each item is presented as a card carrying the creator's handle and avatar, a category label, a like count where one exists, and a direct link out to the original post, repository, video or site. Newly submitted builds are surfaced at the top of the homepage, alongside a prompt inviting visitors to submit their own work. Entries span a wide range of categories, which is itself a picture of what Muse is being used for. Coding & dev tools covers items such as the Browserbase plugin for Muse Code, a guide to Muse Code CLI commands, and the Muse Code Uninstaller utility. Connectors & MCP includes a Linear connector built by Muse in under a minute, the muse-fileapi local file connector, and a developer's guide to building Muse connectors. Games & 3D features five self-playing games written one-shot with Muse Glimmer, a Three.js browser driving demo and a Mini Golf game ported to VR. Benchmarks & research collects tests such as 105 planted bugs pitting Muse Spark 1.3 against frontier models, Spark 1.3's first place on Website Arena, and a privacy teardown of the Muse apps. Other categories reflect the personal-agent side of Muse. Errands & personal agent gathers stories such as a $1,750 unclaimed property find, a $603-a-year car insurance saving, an Alaska flight claim filed from email receipts, and a portfolio-aware Muse feed. Business & commerce covers items like a Squarespace-to-Shopify migration and Shopify Catalog checkout inside Muse. Local & open models collects work on Muse Glimmer, including a free fine-tuning notebook that reports training it faster with less VRAM, and Apps & websites includes builds such as a Tinder-style interface for unfollowing people on Instagram. There is also an Agents & automation category, where projects like TerMuse — a tool that shows a Muse agent's live terminal and an interactive browser side by side — are listed. The site's approach is deliberately indirect: it does not host the builds, run them, or re-publish their instructions. Instead it curates and links. Each listing is a pointer — the description summarises what the build does in a sentence or two, credits the creator by name and handle, and provides an outbound link to the original X post, Reddit thread, GitHub repository, YouTube video, blog resource or website. Visitors can therefore start from the catalog and end up at the primary source, whether that is a repository they can clone, a video they can watch, or a post they can read in full. Submissions are accepted through a dedicated submission page, and the homepage explicitly features newly submitted builds so recently published work gets visibility alongside the wider archive. For anyone assessing Muse, the benefit is a shortcut to evidence. Instead of reading feature lists, visitors can see what has been built, what it cost, what the results looked like, and who did it — for example, a benchmark that measured Muse Spark 1.3 against frontier models on planted bugs, or a report that Muse Glimmer delivered five runnable games at roughly one-fifth of Muse Spark's cost. For builders, the directory is a source of inspiration and prior art: seeing that someone connected Linear in under a minute, taught Muse a custom connector, or drove the Unity CLI to port a game to VR makes it clearer what a next project could look like. And because every card links out, the catalog also acts as a discovery layer for the creators themselves, sending traffic and credit back to their posts, repositories and channels. Concrete uses of ShipWithMuse follow from that structure. A developer new to Muse Code can browse the Coding & dev tools and Connectors & MCP categories to find setup guides, CLI walkthroughs and working connector examples before writing their own. Someone evaluating model performance can go straight to Benchmarks & research and read the collected tests and analyses in one place. A builder looking for project ideas can scan Games & 3D or Apps & websites for examples of what Muse produces in a single file or a short session. Teams curious about the personal-agent capabilities can read the Errands & personal agent entries — flight claims, insurance comparisons, unclaimed property searches — to understand what such workflows look like in practice. And creators can submit their own builds for listing in the catalog. ShipWithMuse is maintained by @mohithkumar808, credited on the site as the curator. It is a web-based catalog. The site also sells sponsorship placements: a sponsored slot the same size as a post, shown every 12 builds on every catalog page, priced at $100 per week, and the site's sponsor strip includes ChatForm and Tgmlabs. The directory draws on a range of build types — X posts, Reddit posts, GitHub repositories, videos, sites, skills, resources and guides — and its Product Hunt listing classifies it under Productivity, Developer Tools and Artificial Intelligence. The through-line is simple: ShipWithMuse turns scattered Muse activity into a single, link-backed catalog. By indexing more than a thousand real builds, letting visitors filter by type and highlight star picks, and pointing every entry at its original public source, it gives developers and observers a practical way to discover what Muse can do — and, if they have built something themselves, a place to submit it.
Greypaint is a Mac app updater built for macOS that finds and installs updates for the apps already on your Mac. It checks Sparkle, Homebrew, GitHub, and the App Store, and answers in one list. Instead of chasing each app's own update mechanism separately, Greypaint presents a single, searchable inventory of installed Mac apps with their versions and update status, so you can see what is behind at a glance and update it in one click. The problem it targets is simple: on a modern Mac, updates arrive through many different channels, and it is easy to miss one. Indie apps publish Sparkle appcasts, tools and desktop apps arrive through Homebrew, some apps ship straight from a GitHub repository, and the Mac App Store handles the rest. Each of those speaks in its own way, and many only mention a new version when you happen to open the app. Greypaint's opening line captures the intent exactly — "You didn't notice. Greypaint did." It checks for Mac app updates with the window closed, so nothing quietly falls out of date while you are working. Greypaint reads the updater each app already has. Sparkle appcasts, described as the feed most indie Mac apps already publish, are checked so the current version sits next to the available one — an appcast moving from 1.13.7 to 1.14.0, for example. Homebrew casks are covered too, so whatever you installed with brew can be updated without a terminal, with versions such as 3.0.14 moving to 3.0.15. GitHub releases are checked for the apps that ship straight from a repository, where tags move from v26.2 to v26.6. For the Mac App Store, updates are counted in Greypaint's list and then opened where macOS insists, pairing App Store tracking with everything else in one place. Autopilot and scheduling decide how far Greypaint goes on its own. Autopilot offers three explicit choices: "Nothing without me," "Security fixes only," and "Everything quietly." With security fixes selected, security fixes install quietly while everything else waits for you, or nothing does. Checks can run on your schedule — hourly, every six hours, daily — or never, unless you ask. Because Greypaint checks for updates while its window is closed, the work happens quietly in the background on whatever cadence you choose, and you can change that cadence whenever you like. It tells you before it touches anything: what changed, what could break, and what it won't do. Big jumps are flagged, so a new major version — 5.4 to 6.0, say — is marked and never installs on its own. You can skip one version, setting a release aside while the next one shows up as usual. If an update is missing, Greypaint says why: when a release needs a newer Mac or a newer macOS, such as one requiring macOS 28, you hear about it rather than wondering why nothing appeared. Old apps are called out as well, including apps still on Rosetta and apps their developer stopped making, shown as discontinued. Rollback is the safety net behind every install. If you didn't like the new version, Greypaint puts the previous one back — the undo button in its tagline, turning a move to 6.0 back into 5.4. Beyond graphical apps, it covers your command-line tools too: Homebrew formulae and npm packages are listed and are never updated without you. The interface keeps your hands on the keyboard, and every shortcut can be changed in Settings — switch appearance (⌘D), check for updates (⌘U), update selected apps (⇧⌘U), and find an app (⌘F). The sidebar separates Apps, Updates, and Ignored, alongside a searchable, filtered inventory of installed Mac apps with versions and update status. The approach behind Greypaint is to reuse what each app already provides rather than replacing it. It reads the updater each app already has — Sparkle, Homebrew, GitHub, and the App Store — and checks every update before it lands. Nothing is invented or routed through a proprietary channel; Greypaint interprets the appcasts, casks, release tags, and receipts that developers already publish. That is why a cask shows one version becoming the next, a GitHub tag moves forward, and the Mac App Store receipt is counted in the same list as the rest, and why the update decision stays in one place rather than scattered across separate tools. The outcome for users is a Mac that stays current without constant attention. You see every app that needs attention, make one decision, and update in one click. Security fixes can be absorbed automatically while riskier changes wait for you. You are told in advance what counts as a big jump, what needs newer hardware or a newer macOS, and what has been abandoned by its developer. Old apps on Rosetta and discontinued apps are surfaced rather than discovered at the worst moment. And when an update does cause trouble, rollback removes the fear from clicking update in the first place. Concrete scenarios follow from those pieces. Someone running a Mac full of indie apps that publish Sparkle appcasts can see every available release in one pass instead of opening each app. A developer whose tools ship from GitHub, or who installed software with brew, gets casks, release tags, Homebrew formulae, and npm packages in the same window and never has them updated without consent. Anyone who wants the Mac App Store counted alongside the rest gets App Store updates listed with everything else. And when a new version goes wrong, rollback restores the previous one. The heading "Find out what's behind, once" sums up the audit-style workflow: one searchable, filtered inventory answering what is out of date. Greypaint can be downloaded for free and tried for 14 days. After that it is $6.49 for a lifetime license, one payment with updates included and no subscription. It requires macOS 26.2 or later, and the download is a macOS disk image. Purchases are activated with the email from checkout and the license key you receive; Greypaint also emails those activation details, which are shown on a purchase-complete screen with a copy button. Taken together, Greypaint replaces a scattered set of updaters with one quiet Mac app updater: Sparkle, Homebrew, GitHub releases, and the App Store in a single list, checks that run with the window closed, autopilot you can tune, flags for big jumps and missing updates, and a rollback when something goes wrong — all for a one-time $6.49 lifetime license.