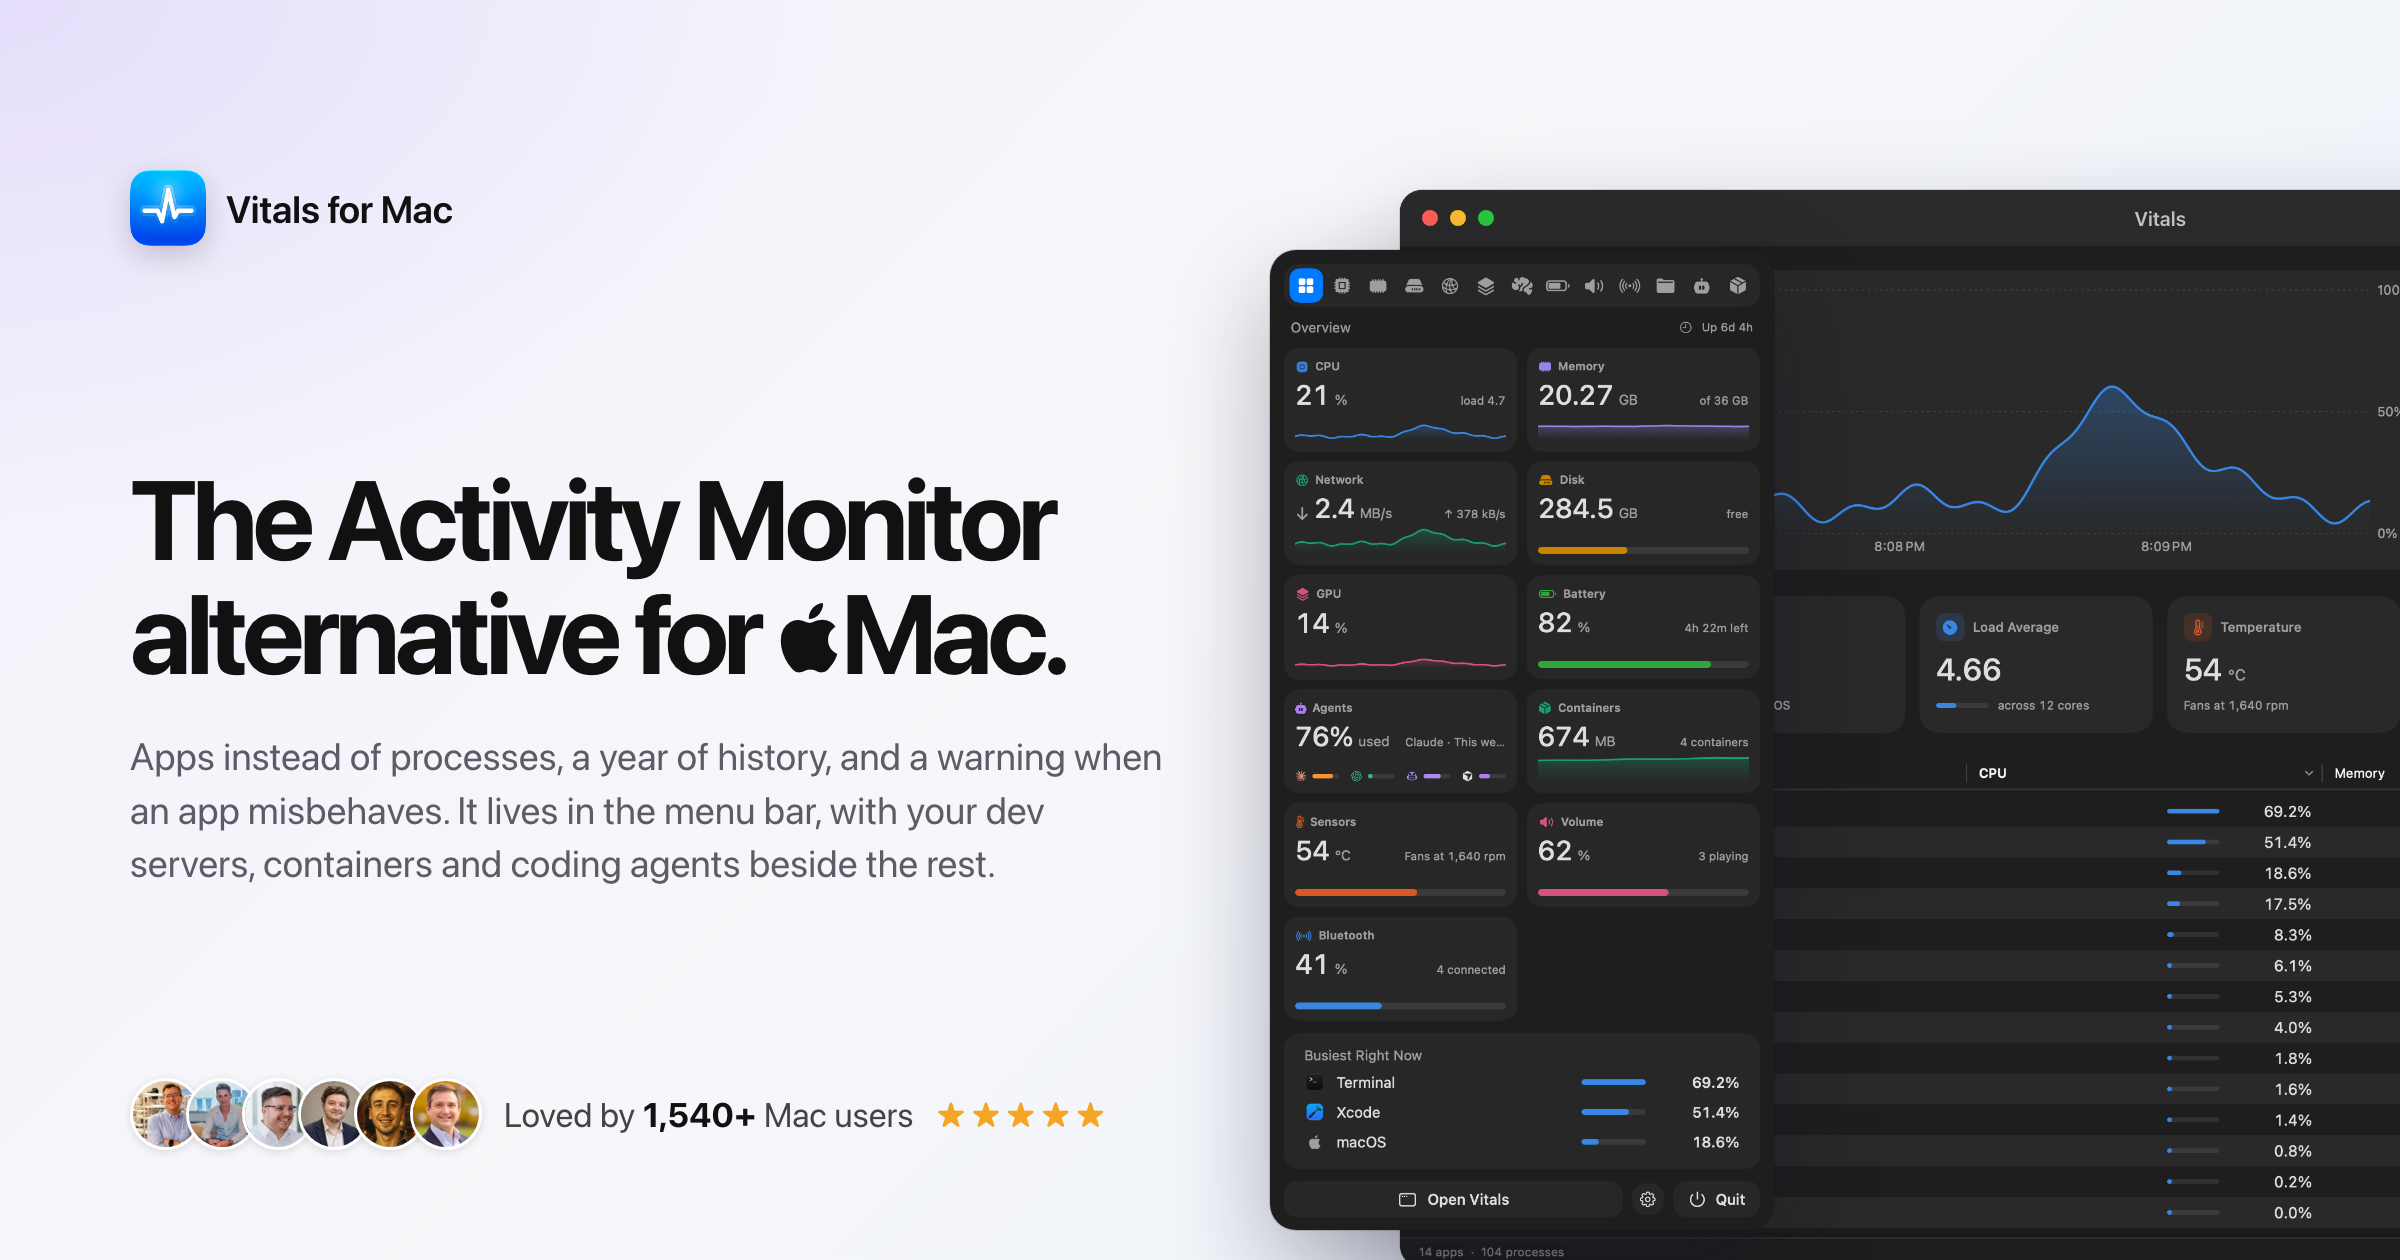
Vitals is an Activity Monitor alternative for Mac that changes how system monitoring is presented: instead of listing roughly 1,000 individual processes, it groups every process under the app that launched it. A working Mac therefore shows about 60 apps instead of 1,000 processes, each with one figure for memory, CPU, energy, disk and network. It is made for Mac users who want a clear, app-level answer to the question 'what is using my memory?'. Vitals keeps 30 days of history, alerts you when an app misbehaves, points out forgotten dev servers, and reports temperatures, fans and battery. Every readout can sit in your menu bar, arranged your way, and it is sold as a one-time purchase.
macOS Activity Monitor lists every process on the system. On a working Mac that is about a thousand rows, a hundred of them called Google Chrome Helper, and to work out which application is actually responsible for your memory or CPU use you have to add the helpers up yourself. Vitals frames the difference simply: Activity Monitor is good at showing what is happening this second, while Vitals also tells you which app is responsible, what happened while you were not looking, and when something needs your attention. It adds every helper to the app that launched it, so each app gets one row and one figure. The result is that 'what is using my memory?' has a one-line answer rather than a long list of similarly named processes.
The first feature group is app-level monitoring across every major metric. Vitals tracks CPU, memory, GPU, disk, network, energy and battery, and it presents each of those metrics per app rather than per process. In the app there are tabs for Overview, CPU, Memory, Disk, Network, GPU, Battery, Sound, Bluetooth and Projects. A Memory by App view, for example, shows Google Chrome at 21.23 GB, VS Code at 8.17 GB, Terminal at 3.86 GB and Safari at 2.69 GB, with the remainder grouped under Other. The same per-app breakdown exists for CPU, disk writes, downloads, GPU use and power draw, so a heavy video call, a runaway browser tab or a rendering job can be traced back to the application that owns it instead of to a helper process.
The second group is history and alerting. Vitals keeps 30 days of history for every metric, per app, selectable as the last 12 hours, 24 hours, 7 days or 30 days, together with which apps used the most. The data is stored in one small file on your Mac. On top of that, Vitals sends alerts when an app misbehaves: a notification when an app hogs the CPU, keeps growing in memory, or hammers the disk or network. The website illustrates this with a Slack alert noting memory up 1.4 GB in an hour, now 3.3 GB, and a Chrome alert showing 70% CPU on average for ten minutes. Activity Monitor offers live graphs and 12 hours for energy but no alerts, so this is where Vitals adds ongoing awareness rather than a single snapshot.
The third group is the menu bar experience. Every readout can be its own menu bar item, covering CPU, memory, GPU, network, disk, temperature or battery, shown as a value, a graph or both, with or without its icon. Holding the Command key lets you drag the items into any order, and the icon turns into a warning sign when your Mac is under strain. Clicking an item opens a dropdown containing every metric on one screen, the busiest apps right now, and a tab for each metric with the apps behind the figure. You can arrange its tiles or switch to a list with one line per metric, and clicking an app opens a window focused on it. Activity Monitor itself has no menu bar presence; at most its Dock icon can show CPU use, which is what Vitals is intended to replace.
The fourth group covers dev servers and open ports. Vitals groups processes by the project folder they run in and shows the ports they have open. It points out a dev server that has done nothing for three days and offers to stop it, and it asks before it stops anything. The website shows an example list with servers on ports 4322, 8000, 4321, 3000 and 5173, labelled with their runtime (node or python) and how long they have been idle or up, with buttons to stop them. A confirmation message reports that storefront-web stopped, freeing 458 MB and port 4322. Activity Monitor has no equivalent, so leaked node processes and forgotten ports have to be hunted down by hand without it.
Beyond those four groups, Vitals includes eight smaller features. Alerts for misbehaving apps, described above, sit alongside per-app volume control so you can turn a meeting up and music down, with nothing recorded. There are temperatures, fans and batteries: CPU and GPU temperature, fan speed, and the battery level in your AirPods, mouse and keyboard (the site shows AirPods Pro left at 42%, right at 58%, case at 80%, plus a Magic Trackpad and Magic Keyboard). You can quit an app or a single process from any list, with Vitals always asking first, and the confirmation warns that quitting Google Chrome will close 96 processes. You can export a 1200 by 630 share card of your memory, top apps and CPU, or copy the whole dashboard, in light or dark. Arrange everything lets you choose the tabs and show, hide and reorder sections, including the dropdown tiles and menu bar items, with a reset. Units you choose covers Celsius or Fahrenheit, bytes or bits, and CPU per core or per Mac.
A distinctive part of the product is its privacy posture. An activity monitor sees every app you run and every project you work on, and Vitals keeps all of it on your machine. There is no account: you buy a license key and there is nothing to sign in to. There is no analytics, so Vitals does not report what you run, when, or for how long. The only two network requests are one that checks for updates and one that checks your license. History storage is one small file on your Mac. For developers working on private codebases and for anyone who objects to telemetry in a system tool, that architecture is the point rather than a footnote.
The overall approach is a grouping layer on top of the process data macOS already exposes. Vitals adds each helper process to the app that launched it, so fifty or a hundred child processes collapse into one row, one figure and one history line. That same grouping is reused across tabs: per-app memory, per-app CPU, per-app disk writes, per-app network, per-app GPU and per-app power all derive from the same app identity. Grouping by project folder extends the idea to running servers, which is why idle dev servers and their ports can be surfaced and stopped. Because the app is native to the machine, the figures come from your own Mac; the interactive demo on the website uses simulated figures precisely because a web page cannot read your Mac and should not.
The outcome for users is a faster answer to ordinary questions: which app is actually using the memory, what happened overnight, and whether something is heading in the wrong direction. Reviews quoted on the site describe the experience in similar terms: users say they find themselves glancing at the menu bar instead of worrying, that Activity Monitor is horrible when juggling dev projects and local AI, that having CPU, memory, GPU and projects in one place is a game changer, and that Vitals is a fast, well-designed upgrade that finally answers questions they had been searching for an app to solve. Paying once and owning the license, with every update included for life, is framed as part of the value.
Concrete workflows described on the site include identifying which browser or app is responsible for memory pressure, as in the reviewer who discovered Dia was using most of their memory; watching what happened while you were away using the 12-hour, 24-hour, 7-day and 30-day history views; cleaning up leaked node processes and idle dev servers holding ports 3000, 4321, 4322, 8000 and 5173; receiving alerts when an app hogs CPU, grows in memory or hammers disk and network; checking CPU and GPU temperature, fan speed and accessory battery levels; controlling volume per app during a call; and exporting or copying a dashboard image for a post or a support thread.
Vitals is aimed at Mac users who want more than Activity Monitor, particularly developers and AI builders running local projects and servers, and people who currently use menu bar monitors such as MenuMeters, iStat Menus or Stats, or who are arriving from Windows Task Manager. It is a Mac app sold at vitalsmac.com, with a waitlist open for Windows. Pricing is one-time: $9 during the launch, rising in steps to $29 as licenses sell, with no subscription. The site notes 1,000 licenses sold at $5 and 96 of 100 left at $9, one key per paid Mac that can be moved at any time, a 14-day refund, and every feature and update for life.
Vitals reframes Mac system monitoring around apps rather than processes. By folding every helper into the app that launched it, keeping 30 days of per-app history, alerting when an app misbehaves, surfacing forgotten dev servers and putting configurable readouts in the menu bar, it aims to answer what is using your Mac in one line. Add local-only data, no account and no analytics, and a single one-time price, and the promise is a simpler, private, faster way to understand what your Mac is doing.
Publisher
A
admin
Launch Date2026-09-29
Platformdesktop
Pricingpaid