Category Focus/categories/analytics
Analytics AI Tools
Discover and compare the best analytics AI tools and software. Browse 115+ curated tools with reviews and rankings.
Projects tracked
115
Sort mode
RECENT
Page
4
Discover and compare the best analytics AI tools and software. Browse 115+ curated tools with reviews and rankings.
Projects tracked
115
Sort mode
RECENT
Page
4
LLMagnet is the official WordPress plugin that makes a website visible and understandable to AI assistants such as ChatGPT, Claude, Perplexity and Gemini. It tracks visits from AI bots in real time, gives insights into how language models interpret your content, measures an AI Visibility Score, automatically generates llms.txt files and manages schema.org structured data so that models can accurately read, cite and act on your pages. The product is made by web creators and built for agents and marketers, helping brands build a measurable presence in the AI ecosystem instead of guessing how AI search treats them. Search behavior is shifting. People increasingly ask AI assistants directly for answers, recommendations and products, so the traffic that matters no longer arrives only from classic search engines. AI crawlers and assistants fetch, parse and summarize pages on their own terms, and llms.txt is described by LLMagnet as an emerging standard, like robots.txt for search engines, that helps AI models understand a site's structure and content. Without that guidance, and without any data about which bots visit and what they read, site owners are essentially blind to how AI represents them. LLMagnet closes that gap by giving websites an AI visibility layer: real-time analytics on AI bot activity plus the files and schema data that make content easier for models to read, rank, connect with and trust. It turns an opaque new channel into something that can be watched, measured and improved. The core of the plugin is LLM Analytics, which tracks real AI-bot traffic and reports detailed insights into visits, impressions and clicks coming from major models including ChatGPT, Gemini, Claude and more. LLMagnet detects visits from ChatGPT, Claude, Perplexity, Gemini, Grok, Bing AI, Mistral, DeepSeek, Llama and others. Sitting alongside the raw traffic numbers is the AI Visibility Score, a single metric that reflects how well large language models can access and understand your content across the web. Trends & Insights then tracks that visibility over time so you can spot rising opportunities and content drops instantly, turning scattered bot activity into a picture of whether your AI footprint is growing or decaying. To make a site AI-ready, LLMagnet automatically builds and maintains an llms.txt file so AI crawlers can better understand site structure and content focus, and it keeps that file up to date without manual work. Depending on the plan, it also generates a Full-llms.txt and .md files. The plugin manages schema.org structured data as well, which helps AI assistants accurately read and cite pages. Because llms.txt is positioned as robots.txt for AI, it acts as a signpost for crawlers; generating it automatically means site owners do not have to research the format, write the file or remember to refresh it whenever content changes. Prompt Tracking & Optimization shows where your brand actually appears in AI answers. LLMagnet tracks the prompts that mention your site and shows how your ranking evolves over time, including which prompts include your brand, how visibility shifts by LLM, and what to improve next. Alongside this, Automated Reports & Insights sends weekly and monthly reports that summarize your visibility and growth, with auto performance reports, visual traffic breakdowns and actionable visibility tips. Together these features move the product beyond measurement into guidance: you can see not only that AI assistants are reading your pages, but which questions bring you in and where you are missing. For stores, LLMagnet is positioned around the future of AI-driven commerce. It turns a shop into AI-ready content by connecting to your product data so that AI can display accurate information in generative search, with auto product and price sync keeping details current, an AI-search visibility boost and product mention tracking. WooCommerce integration and product tracking are part of the Plus plan, and the FAQ notes that Plus and Enterprise plans add product visibility scores and AI revenue funnel tracking for WooCommerce stores. The result is that product listings, prices and brand mentions stay aligned with what assistants tell shoppers. Installing LLMagnet starts from the WordPress plugin directory: you enter your WordPress site and are redirected to your site's plugin installer so the plugin can be added in one click, with no setup or code required. Once active, it begins capturing real-time AI bot activity. The dashboard reveals which AI bots visit your site, what they read and how to improve your visibility inside AI answers through visual dashboards. Compatibility is broad: the plugin works with Elementor, Gutenberg, Divi, WooCommerce and more, runs alongside Yoast SEO and RankMath without conflicts, and integrates into the Elementor editor with per-page AI visibility scores and schema management. On WordPress 6.9 and later it connects directly to Claude, ChatGPT and Cursor via the WordPress Abilities API so AI assistants can query your site's data natively, and an MCP Connector is included in the plans. The approach is deliberately lightweight and privacy-safe: file generation and analytics run in the background, so there is no impact on front-end performance or page load speed, and bot visit analytics are stored locally in your WordPress database and never sent externally. Optional integrations are off by default, and the tool is fully GDPR-compliant with built-in data export and erasure tools. The stated benefits revolve around control and clarity. AI Visibility Control means knowing exactly how large models see your content; Smart Automation keeps llms.txt and your data always updated automatically; Deep Insights analyze which pages drive the most AI engagement; Enhanced Collaboration streamlines workflows with team-friendly features; Data Security safeguards your data with top-tier encryption; and Continuous Improvement lets AI adapt and improve with evolving data. In practice, users describe straightforward setup, clear understanding of AI-related traffic to their site, and a practical llms.txt generator that saved them time. LLMagnet is explicitly not framed as a magic SEO plugin, but as a solid tool for gaining visibility into how AI search is evolving. LLMagnet is aimed at web creators, marketers, solopreneur store owners and WooCommerce store managers who want to prepare for AI-driven discovery rather than react later. The free plan is available with no credit card required, and core features such as analytics, llms.txt generation and schema tools work on any WordPress site. Paid tiers add depth: Pro at $29 per month per site covering analytics from ChatGPT, Claude and Perplexity plus Full-llms.txt, .md files and an MCP connector; Plus at $100 per month per site with analytics from all bots, WooCommerce integration, product tracking and product visibility; and Ultra at $149 per month per user with prompt tracking and chat support. Yearly billing lowers those prices, and a Product Hunt launch offer advertises 50% off. A Shopify app is also available alongside the WordPress plugin. LLMagnet gives WordPress and Shopify sites a measurable AI visibility layer. By tracking AI bot traffic, scoring how well models can access your content, generating the llms.txt and schema data crawlers look for, and tracking the prompts where your brand appears, it converts an opaque new channel into something you can watch, report on and improve. For teams that want evidence of how AI assistants read, cite and recommend them, that combination of analytics, AI-ready files and prompt tracking is the product's core value proposition.
Neopress is an AI website builder that lets you build, publish, and grow a website by chatting with an AI assistant. Instead of assembling pages by hand, you describe what you want in plain language and the assistant helps create pages, organise structured content, and refine the result. It is aimed at people who need a real content workflow behind their site — a built-in CMS, server-rendered SEO, GEO tools, forms, and analytics — rather than a static page that never changes. Neopress describes itself as connecting website creation, structured content publishing, SEO tools, and traffic insights into a single workspace so you can keep improving after launch. The problem Neopress addresses is that a website is not finished when it goes live. As the site explains, a website needs ongoing content updates, search settings, and performance review after launch, and those tasks usually live in separate tools. Neopress was built by a team that has shipped hundreds of content sites, and it is optimised for one thing: websites that get found — clean structure, a real CMS, and SEO that works by default. The product brings content management, search configuration, and analytics into one place, so the post-launch loop of updating, measuring, and improving becomes part of the same workflow as building the site in the first place. Neopress works through agents that operate alongside you. The first is a design agent: describe the page you want in plain language and watch it take shape, then refine layout, copy, and style through conversation. The stated advantage is that there are no templates to wrestle with and no design tools to learn. The second is a CMS agent: work with AI to draft and organise content in CMS collections, review the copy and SEO settings, then publish when you are ready. The Launch plan includes unlimited pages, unlimited CMS collections, and unlimited forms and lead capture, so the content structure of the site is not capped by the plan. Search visibility is handled by built-in SEO and GEO tools. Neopress delivers page content as server-rendered HTML, so search engines and AI crawlers read the structure and text of a page instead of an empty browser-rendered shell. Metadata and Open Graph settings can be reviewed and edited for search results and social previews. Neopress generates a sitemap.xml automatically so search engines can understand and crawl the site structure, and it publishes the emerging llms.txt standard for you — a clean, curated map of your key pages for AI assistants. Structured data (JSON-LD) can be added and reviewed to help search engines understand a page's content, and robots.txt gives control over crawler access so you can block pages you do not want indexed. Beyond the core tags, Neopress adds the plumbing that content sites usually need later: HTTPS with SSL by default, automatic canonical tags to avoid duplicate content, a custom 404 page, 308 redirects from old URLs to new pages when reorganising a site, an automatically generated RSS feed, image alt text for accessibility and image search, and clean, human-readable, keyword-friendly URL slugs. Fonts are self-hosted and preloaded to cut layout shift and speed up first paint, images are optimised for size, format, and delivery, and pages are responsive so you can review how they appear on mobile screens. Neopress states it is built for Core Web Vitals, with server rendering, caching, and a global CDN supporting fast page delivery. Multilingual publishing lets you configure site languages, review translations, and publish language versions with hreflang support. Neopress describes its overall approach as a flywheel with four stages: build, publish, measure, and improve. You build by chatting with AI, publish structured content through the CMS, measure with the analytics dashboard, and improve by asking AI to review site and performance data. One agent focuses on measurement: ask AI about the analytics available for your site, review its explanation and suggested changes, then choose what to improve. Another agent reviews available site and performance data, identifies issues, and suggests changes for you to decide which improvements to apply. The recurring theme is that AI proposes and explains, while you review and decide — publishing and publishing changes always remain your choice. The stated outcome is a website that gets found and keeps improving. Because every page ships as real HTML rendered on the server, crawlers can access content without relying on browser-side rendering. Because the CMS, SEO settings, and analytics sit in the same workspace, there is no gap between writing content and configuring how it is indexed. Analytics covers tracking search queries, checking post indexing status, seeing which LLMs crawl your pages, and tracking paid, campaign, and visitor data, with Google Search Console and Google Analytics integrations available on the Growth plan. On ownership, Neopress states that you retain full ownership of all content, copy, and structural assets generated by the AI — Neopress provides the hosting and the engine. Neopress is used to build and grow content-driven websites. Its template gallery shows the range: Blog & Editorial, Corporate, Documentation, and Landing Page templates, with published examples spanning skincare and dermatology clinics, a non-surgical spine and joint hospital, an oriental medicine clinic, a boutique Pilates studio, an artisan bakery and cafe, a design studio journal, and a bespoke jewellery atelier. For teams with an existing site, Neopress offers website migration — moving your existing pages, content, domain, and redirects over without a rebuild from scratch — and design services for a new page or a fresh look, discussed directly with the Neopress team. Day to day, the workflow is drafting and organising content in CMS collections, publishing pages, then reviewing analytics and applying SEO improvements. Pricing is subscription-based with plan-based AI usage and traffic allowances, and it starts with a 7-day free trial. Launch costs $25 per month per site with 10,000 pageviews per month included and $1 per additional 1,000 pageviews. It includes AI chat creation and editing, unlimited pages, unlimited CMS collections, unlimited forms and lead capture, built-in SEO and AEO optimisation, search-readable pages via SSR, llms.txt, robots.txt and sitemap control, JSON-LD structured data, RSS feed, URL redirect rules, custom domain connection, logo and favicon settings, a social share (OG) image, a custom 404 page, removal of the Made by Neopress badge, a real-time analytics dashboard covering the last three months, one editor seat with unlimited viewers, version history and Rewind restore, and MCP support. Growth costs $99 per month per site with 50,000 pageviews included, about three times the AI usage of Launch, ten editor seats with role-based permissions, real-time collaboration presence, full analytics with paid, campaign and visitor tracking, visibility into which LLMs crawl your pages, search query tracking, post indexing status, Google Search Console and Google Analytics integrations, two years of data history, multi-language support, a multilingual sitemap with hreflang, and priority support. When a trial ends or you stop paying, published content remains available on your Neopress subdomain on the Free plan while custom domains pause. Pageviews count human visits plus crawls made by AI to cite your pages in its answers; search engine indexing and AI training crawlers are not counted. Security and trust features include Supabase infrastructure with authentication-controlled database access, Supabase Auth, Vercel's DDoS protection, Polar as merchant of record for payments, and version history for restoring previous versions of pages and site layout. In short, Neopress positions itself as one AI-powered loop for building and growing a website: you create pages through conversation, publish structured content through a real CMS, ship server-rendered HTML that search engines and AI crawlers can read, and then use analytics plus AI review to decide what to improve next. The core value proposition is a website that gets found and keeps getting better, managed end to end in a single workspace rather than scattered across separate building, CMS, SEO, and analytics tools.
Visiby is an AI visibility platform that measures and grows how brands appear across AI search platforms, including ChatGPT, Claude, Perplexity, Gemini, Google AI Overviews and Copilot. It acts as a visibility layer for the AI-search era, mapping entity presence across the top AI engines so marketing teams can see where they are recommended, where they are missing, and which competitor is being cited instead. The product is built for marketing operators and agencies who need to own the answer layer rather than only rank in traditional search results. Vendor discovery has moved. According to the content, 1 in 3 B2B buyers now start vendor research inside an AI assistant, and ChatGPT, Perplexity, Google AI Overviews, Gemini and Copilot are quietly intercepting traffic that used to land on a company's site — if the model does not surface the brand, the conversation never starts. The site states that 62% of enterprise marketers are already optimising for AI engines, citing the State of AEO 2026 from FNA Research, while the well-funded brand in a category treats Answer Engine Optimisation as a budget line whose citations compound week over week. Meanwhile, Visiby argues that zero tools in a typical stack measure what AI is saying about a brand: Semrush ranks, Ahrefs ranks, GA counts clicks, but none of them sample prompts, parse model answers, or explain why ChatGPT recommended a competitor instead of you. Visiby exists to close that blind spot with a continuous, prompt-level view of AI answers. The workspace opens on an Overview that serves as the weekly headline: search performance, AI visibility and the next moves the team should ship, readable in 90 seconds. Headline scores include Visibility, Share of Voice, Prompts won and Briefs ready. Search Performance explains a brand's organic traffic and click-through rates, tracking clicks over 28 days with month-over-month change, impressions, click-through rate and average position across tracked non-brand terms. AI Visibility shows where a brand appears and where it does not, presenting per-engine citation share across every prompt in the universe, with each cell clickable to reveal the underlying answer. In the illustrated workspace, ChatGPT sits at 42%, Perplexity at 51%, Claude at 34%, Gemini at 24% and AI Overviews at 18%. The Prompts Explorer is a workbench for the full prompt universe — more than 50,000 AI prompts are tracked weekly, and the sample workspace shows 50,127. It supports stacked filters, a cluster view and a three-way live answer diff, and each row drills into which competitor was cited, why, and the play to win the prompt back. The Citations Explorer works beneath the prompt universe across every URL the engines cite — 2,418 URLs in the example — ranking every cited URL and identifying honey-pot pages, dead-weight pages and counter-content briefs, with passage-level provenance. The Brand Entity module shows the adjectives a brand owns and the ones owned against it across engines, with per-engine portraits and reframe plays to move them; the sample adjective sets include trustworthy, established, enterprise, scalable, innovative, modern, consultative, agile, long-tenured and data-driven. Competitor Intelligence reads the field at a glance, presenting citation share by brand and topic with clickable cells that drill to the prompts and passages behind them, plus a per-competitor recipe diff comparing cited elements across engines, such as H2 headings, FAQ blocks, tables and lists. Recipe Intelligence delivers a per-engine pulse on which on-page element the AI is actually extracting from, producing the structural blueprint a team should publish to; Visiby reports that seven elements are tracked, including H2 headings, FAQ blocks with FAQPage schema, tables, bulleted lists and case studies. Site Audit is a citability-first audit that ranks every issue by AI impact with the fix and affected URLs attached, surfacing examples such as pages blocked from indexing, pages missing OpenGraph tags and meta descriptions, thin pages under 250 words, missing Organization schema, missing FAQ schema and image alt text gaps. The Action Plan converts all of this into a prioritised, priced playbook ranked by effort against impact, where every move carries an argument, a score breakdown covering why-now signal, forecast confidence, effort and dependency, evidence links, and a ready-to-ship deliverable brief. Visiby runs as a weekly ritual. Every Tuesday at 07:42 IST, the platform fuses three live data streams — the prompts buyers actually ask, where the brand is losing citations, and the recipes competitors win with — into one prioritised action plan, with no analyst required. The pipeline runs overnight and lands in the inbox as a citation sweep, share-of-voice deltas, a prioritised action plan, content briefs and an executive summary. A weekly digest email example reports the number of prompts run across engines, the movement in citation share, the action moves ranked by projected lift in points, and a forecast of the week when citation share returns to a target level. The platform continuously samples engines, and the site positions the cadence at seven days from signal to a shipped fix. Benefits described include replacing guesswork with evidence about what AI engines recommend, seeing exactly which competitor is being cited first on high-value prompts, and knowing which structural elements and content formats win citations on each engine. Instead of a dashboard nobody opens or a spreadsheet exercise, teams receive an inbox-ready brief with ranked moves and attached briefs, so prioritisation and writing can start immediately. Ranking moves by effort against impact lets a small team focus on the highest-lift work, and the prescribed fixes — schema, content refresh, comparison pages, original research — are tied to specific projected visibility gains. Concrete scenarios in the content include a marketing team reading the weekly overview and shipping the queued moves; a brand losing citation share to a named competitor and building a comparison page in response; refreshing a contact page for AI parseability because it lacks crucial entity definitions and brand identifiers; adding FAQ schema to a services pillar of 14 core URLs missing structured Q&A data; producing original research on AEO benchmarks to capture data and stats queries; and running community and earned-media plays such as a Reddit thread cluster or listicle outreach to G2 and Capterra. Agencies can use the same workspace to run client AEO programmes, and the Agency tier supports white-label client reports and multi-workspace reporting. Visiby is aimed at marketing operators, enterprise marketers, SEO and AEO specialists, and agencies. It complements rather than replaces existing SEO platforms, and the site compares its capabilities against Semrush, Profound, Conductor and Ahrefs across AI visibility tracking on five engines, SEO and rank tracking, brand entity audits, passage-level citation provenance, recipe intelligence, priced action plans, ready-to-ship content briefs, an autonomous weekly pipeline and multi-workspace reporting. Pricing has four tiers: Lite at $49/mo with 25 prompts a month and one seat; Starter at $99/mo with 50 prompts a month, 10 action items and Site Audit plus Action Plan; Pro at $249/mo with 150 prompts, 30 action items, three seats and three brands, daily refresh, Brand Entity, Competitor Intelligence, Sentiment Analysis and priority support; and Agency at $499/mo with 500 pooled prompts, 50 action items, 10 seats and 10 workspaces, white-label client reports, API access and SSO/SAML, custom engines and regions, and a dedicated success manager with an SLA. A free visibility report is offered in 60 seconds with no card required. That combination makes Visiby a visibility layer for the AI-search era: it measures how brands and competitors appear inside AI-generated answers, explains the structural recipes that earn citations, and turns those signals into a prioritised, priced plan a team can ship on Monday.
Drive is an iOS app that turns the phone already in your car into a vehicle telemetry rig. It captures g-force, braking, cornering, and the full trace of a drive, and it flags license plate reader (LPR) cameras as you approach them. The app is built for driving enthusiasts who want telemetry data on their next weekend drive without installing specialized hardware, wiring looms, or dongles. Drive requires no laptop and no sign up — you open the app and drive. It positions itself as a simple route to driving fun with real driving data attached. The product grew out of a gap its maker experienced firsthand. The maker spent a few years as a design lead on autonomous driving interfaces for Android Auto — the work of making a car drive itself well — and then spent weekends in a 27-year-old car doing precisely the opposite, badly, for fun. Drive is what came out of that gap. The problem it addresses is that dedicated vehicle telemetry setups are expensive and complicated: the category Drive is up against costs between $800 and $3,000 and involves installing a wiring loom. Meanwhile, the phone already sitting in the car has contained an accelerometer, a gyroscope, and GPS for a decade. Drive's premise is that this gap between costly telemetry hardware and the sensors already in your pocket is most of the product. The core of Drive is its telemetry capture. The app measures g-force, braking, and cornering, and records the full trace of a drive. Rather than relying on external sensors, it draws on the phone's existing hardware to log how the car behaves through acceleration, deceleration, and turns. This gives drivers a record of the dynamics of a session — the kind of data that enthusiast drivers and track-day participants traditionally gather with dedicated data loggers. For anyone who wants to see how a particular corner was taken or how hard a braking zone was, the trace provides that feedback. Because the trace is captured from the phone, there is no wiring loom, no dongle, and no laptop involved anywhere in the process. Drive also flags license plate reader cameras as you approach them. This feature began as a personal itch: the maker noticed Flock cameras appearing everywhere and wanted an alert when a drive came up on them. In the app, LPR camera locations surface as you come up on them, so drivers know about the cameras before passing rather than discovering them after the fact. For people who care about privacy, this turns an otherwise invisible part of the roadside into something the driver is consciously aware of. A user in the launch discussion asked where the camera locations come from — whether something like DeFlock's OpenStreetMap layer or a dataset of the app's own — but the available content does not state the underlying data source. A defining characteristic of Drive is everything it does not require. There is no wiring loom to install, no dongle to pair, no laptop needed to run it, and no sign up before you can start driving. Those omissions are deliberate rather than incidental: the product's value comes largely from removing the setup that usually stands between a driver and telemetry data. The phone already in the car, with its accelerometer, gyroscope, and GPS, supplies the measurements instead of dedicated hardware. This makes Drive dramatically simpler to begin using than hardware-based telemetry rigs, which cost far more and demand installation. The maker summarizes the whole proposition as no wiring loom, no dongle, no laptop, no sign up — just driving fun. Drive's overall approach is to replace dedicated telemetry hardware with software running on a device the driver already owns. The phone's onboard accelerometer and gyroscope sense motion and orientation, while GPS provides positional context for the drive. From those inputs, the app produces g-force, braking, and cornering readings and assembles them into a full trace of the session. Alongside the driving data, the app uses location to flag license plate reader cameras as they are approached. The result is a telemetry experience with essentially no hardware footprint: nothing to wire in, nothing to plug in, and nothing to carry beyond the phone. The maker frames this substitution — an expensive rig versus the sensors already in your pocket — as the essence of the product, and as the thing that made the app worth building. For drivers, the benefit is access to telemetry that would otherwise demand a costly, hardware-heavy setup. Instead of spending $800 to $3,000 and installing a wiring loom, a driver can use the phone already in the car. There is nothing to wire up, nothing to plug in, and no account required before driving, so the time between deciding to go for a drive and capturing data is effectively zero. The LPR alert adds a distinct privacy benefit: drivers concerned about license plate reader cameras get a heads-up as they approach those locations. Together these benefits point to a single outcome the maker names directly — driving fun, made measurable, without the usual friction. Drive is designed around the weekend drive. The maker's own scenario — spending weekends in a 27-year-old car, driving for fun — is the canonical use case: a driver takes the car out, launches the app, and captures the g-force, braking, and cornering trace of the run. Because there is no setup cost in time or hardware, the app also suits spontaneous drives rather than only planned track sessions. Privacy-conscious drivers can use the LPR flagging to stay aware of license plate reader cameras along familiar or unfamiliar routes, a use that arose from the maker noticing Flock cameras everywhere. Experienced users of dedicated data loggers are invited to try Drive and compare. Drive is an iOS app, available on the App Store, and it has been tagged with iOS, Cars, and Privacy on Product Hunt under a Maps and GPS category. It targets driving enthusiasts — people who take weekend drives, drivers of older cars, and users who have experience with real data loggers such as AiM, VBOX, or Racelogic. The maker has explicitly asked that audience what they would miss most when moving from dedicated data loggers to a phone, and said that is the list the product is being built from. Drive is free to start. No specific third-party integrations, additional hardware, or broader tech stack components are described in the available content. Drive's core value proposition is straightforward: it makes the phone you already carry into a vehicle telemetry rig, capturing g-force, braking, and cornering traces without a wiring loom, dongle, or laptop, while also flagging license plate reader cameras as you approach them. Free to start and requiring no sign up, it lowers the barrier to measuring your driving to essentially nothing. It is, in the maker's own words, just driving fun.
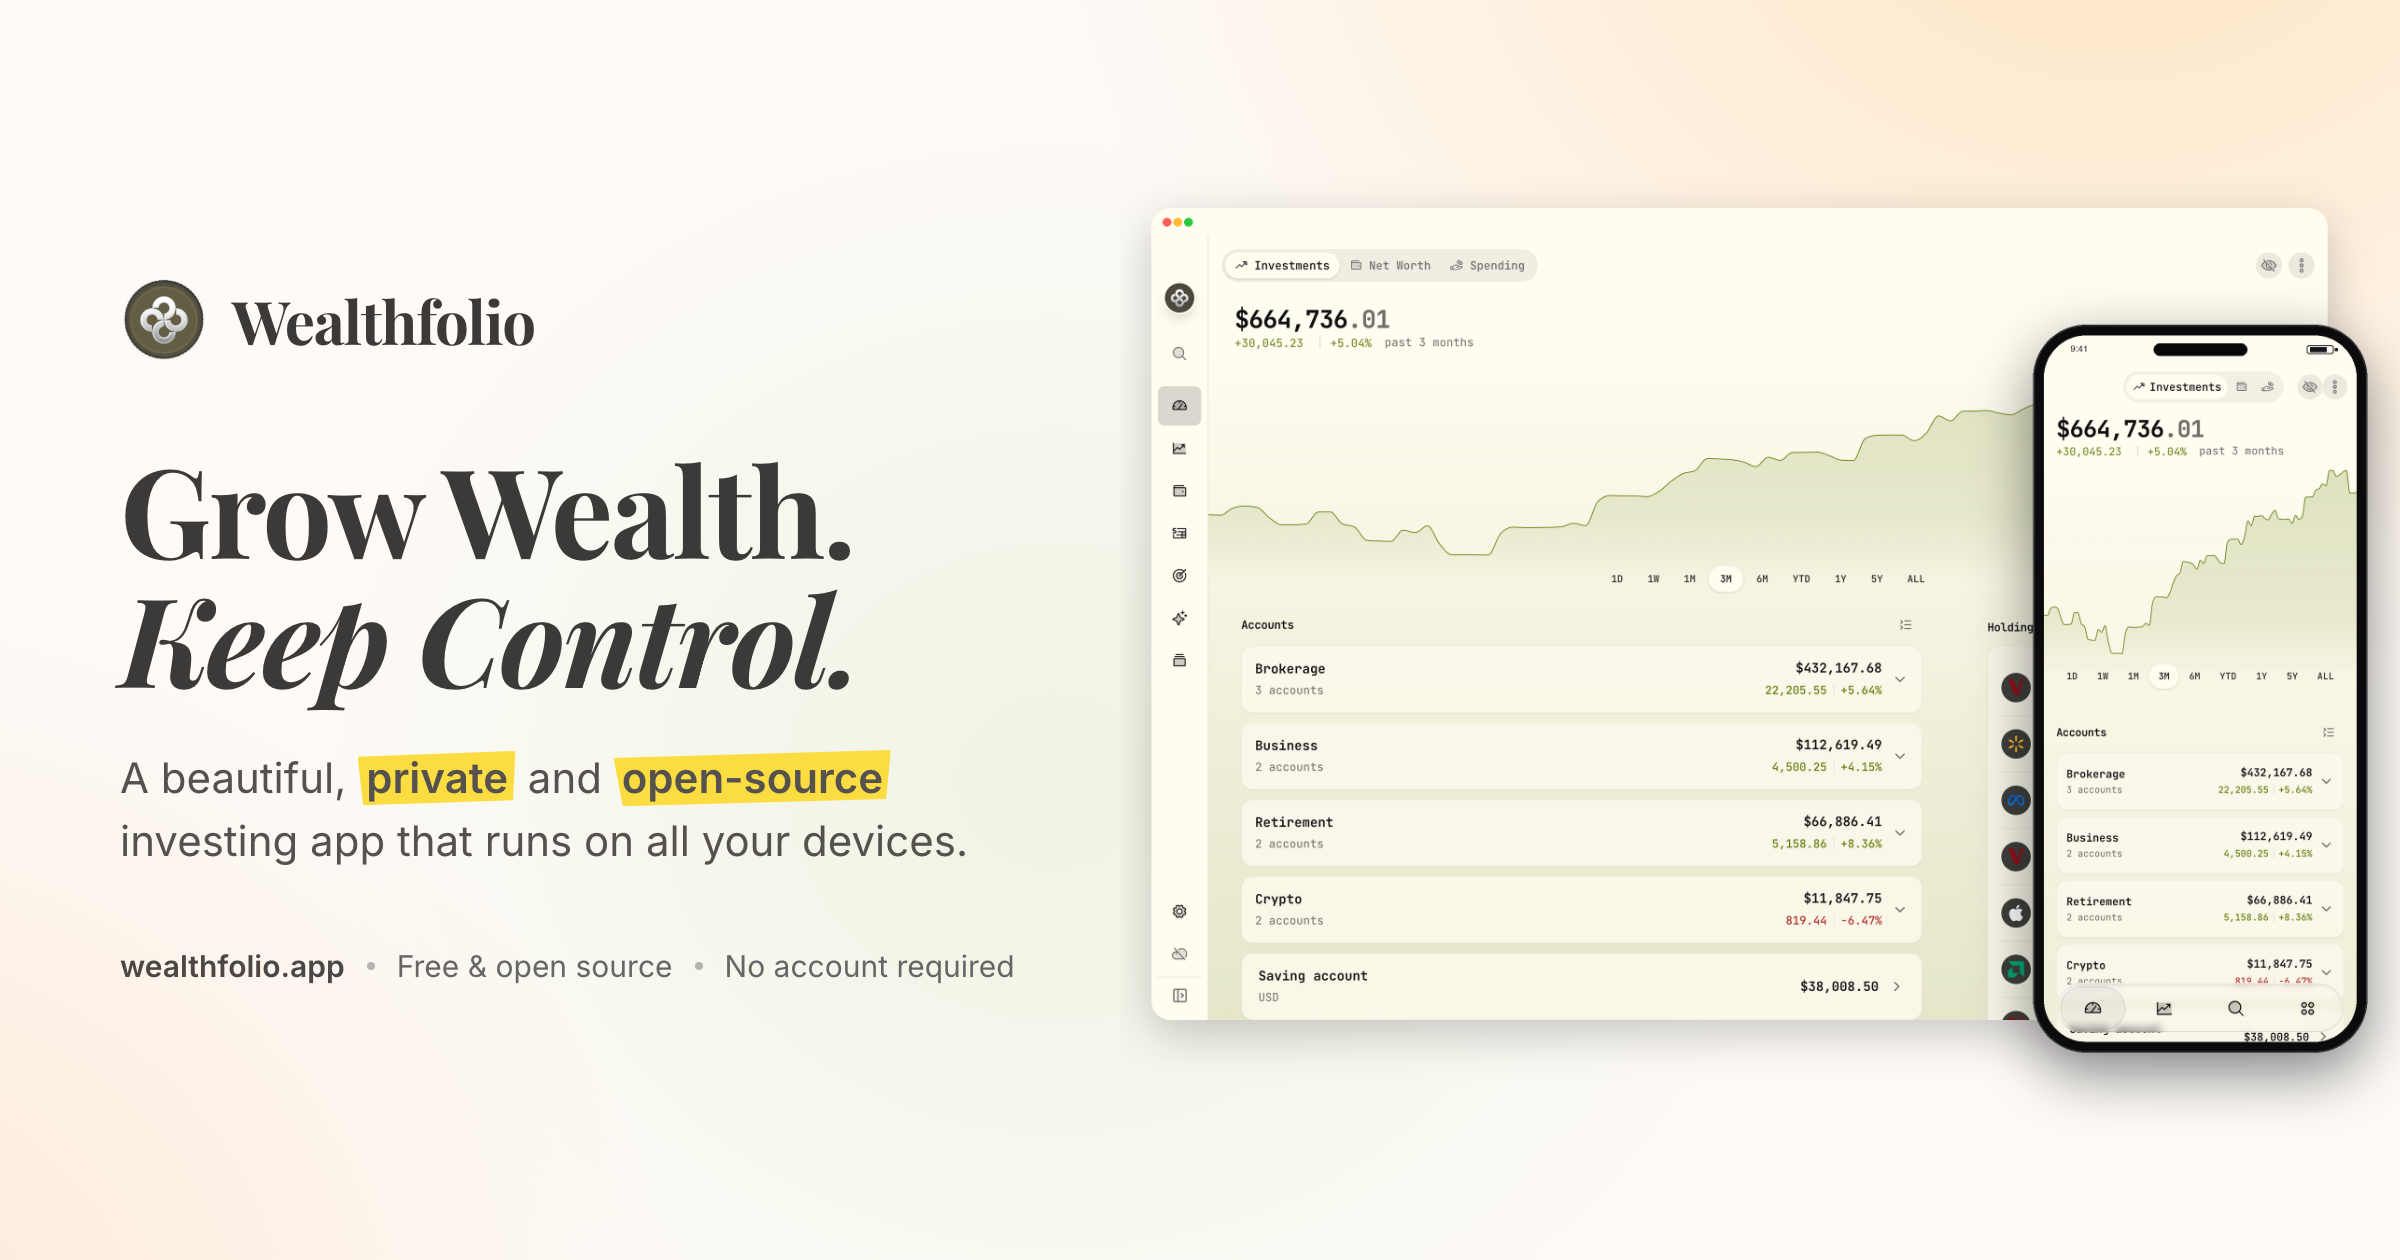
Wealthfolio is a private, open-source investing and personal finance app that runs locally on all your devices. It lets you track holdings, performance, allocation and income across your accounts, follow your net worth, understand your spending, and plan for goals and retirement. The product is aimed at people who want to grow their wealth while keeping control of their financial data, and its core app works without an account or a subscription. Wealthfolio is available on desktop, iPhone and iPad, and can also be self-hosted so you can access it through a web browser on infrastructure you control. The project describes itself as a beautiful, private and open-source investing and personal finance app that runs locally. The problem Wealthfolio addresses is the trade-off many people face between useful financial software and control over sensitive data. Traditional money apps typically require an account and keep financial history in a cloud platform, which means your financial history becomes dependent on another service. Wealthfolio takes the opposite approach: it runs locally, works without an account, and keeps your financial history under your control. The project is also open source, so the code can be inspected, contributed to and run on infrastructure you choose, and users are not forced to create an account or commit to a subscription before they can start. In the investments area, Wealthfolio brings all your brokers and banks into one view. You can track holdings, performance, allocation and income across your accounts, and import CSV statements from anywhere, which means data from a brokerage or bank that is not automatically supported can still be brought into the app. Portfolio Insights help you understand your asset allocation, sector exposure and geographic distribution, so you can see how your money is spread rather than just what it is worth. A Performance Dashboard lets you compare accounts and benchmark against the S&P 500 or any ETF. Allocation Targets & Rebalance let you set target weights, see your drift and get a clear rebalance plan, while Income Tracking follows dividends and interest income across your entire portfolio. Net Worth Tracking pulls all your assets and liabilities together so you can see your complete financial picture over time, rather than looking at individual accounts in isolation. The Spending & Budgets area tracks cash flow, auto-categorizes transactions and helps you build budgets that fit you. Together these tools let you follow both sides of your finances: what you own and what you owe, and where your money is going month to month. Planning tools cover both long-term retirement and shorter-term goals. The Retirement & FIRE Planner provides a year-by-year simulation with a Monte Carlo Risk Lab and a dedicated FIRE mode, so you can model how a plan might evolve under different conditions rather than relying on a single projection. The Goals & Save-Up Planner projects savings to a target with a milestone glide path and an on-track status, which makes it easier to see whether you are moving toward a specific purchase or savings milestone. Contribution Limits help you stay on top of IRA, 401(k) and TFSA contribution room, so you do not lose track of how much you have already contributed or how much room remains. Architecturally, Wealthfolio keeps a local database on your device where accounts, transactions and history are stored. You can install it directly as a standalone application, or self-host it with a Docker deployment and access it through a browser. Wealthfolio Connect is not a third way to run the app; it is an optional paid service that adds automation and synchronization on top of a standalone or self-hosted setup. Connect automatically imports from your brokerages through aggregators such as SnapTrade and keeps your Wealthfolio database in sync across devices. The core app remains fully usable on its own, with manual accounts and transactions, CSV imports and local data ownership. The main benefit is keeping your financial life under your control. Because the app runs locally and works without an account, your financial history stays on your devices instead of becoming dependent on another cloud platform. Because it is open source, you can inspect the implementation, follow development, contribute through GitHub, or run the software on infrastructure you control. Flexibility is another outcome: you can start free with manual tracking and add automation only when manually maintaining your financial data no longer makes sense. Typical use cases include importing CSV statements from a broker or bank to consolidate holdings in one view; tracking net worth across assets and liabilities over time; tracking cash flow and building budgets with automatically categorized transactions; comparing accounts and benchmarking returns against the S&P 500 or an ETF; setting target allocation weights and following a rebalance plan; and projecting retirement or FIRE scenarios year by year. Users who want everything in one always-available place can self-host with Docker and reach Wealthfolio from a browser, and households that want shared finances can use Connect's household sharing. Wealthfolio is available as a standalone install for macOS, Windows, Linux, iPhone and iPad, and as a self-hosted instance reachable through a web browser. The Wealthfolio app is free and open source and does not require an account, while Wealthfolio Connect is an optional subscription for automatic brokerage imports, encrypted device sync, household sharing, background updates and connection management. The project can be extended through add-ons such as the Investment Fees Tracker, Goal Progress Tracker and Stock Trading Tracker, and through custom price feeds for assets and markets not covered by the default providers. Supported AI and agent integrations are available through an MCP server, and an AI Assistant lets you ask questions about your portfolio. In short, Wealthfolio combines investment tracking, net worth tracking, spending and budgeting, and retirement and goal planning in one app that stores your data locally. It is free and open source by default, works without an account, and can be extended with automation through the optional Connect service. For anyone who wants a complete picture of their finances without handing their financial history to another cloud platform, Wealthfolio's primary value proposition is simple: grow wealth, keep control.
FreeScan.app is a website audit tool that reviews any public URL across SEO, AEO, GEO, website security, accessibility, and design. It is built for builders, developers, and site owners who want to know what is hurting their visibility, trust, and conversions. A single scan runs 40 focused checks and returns scores, supporting evidence, prioritized fixes, and insights. The free audit requires no signup and no private access, so anyone can paste a public page and immediately see where the page stands and what to work on next. The stated purpose is to uncover problems and missed opportunities and turn them into an actionable plan rather than an unexplained score. Most site owners do not know which specific issues are holding a page back. Auditing normally means piecing together separate tools for SEO, security headers, accessibility, and design, then interpreting raw output without context. FreeScan.app addresses that fragmentation by running discoverability, security, accessibility, design, and page quality checks in one focused scan on one public URL. Every finding is paired with evidence and an explanation of why it matters, so the user can decide what to fix first. The site positions this as a way to stop guessing whether a page is crawlable, secure, accessible, clearly designed, or ready to convert before a launch, campaign, or SEO push. Running the free audit is deliberately simple. You paste any public page URL and start a scan without signing up or granting private access. The scan performs 40 focused checks across discoverability, security, accessibility, design, and page quality. Results are presented as four category scores — SEO / AEO / GEO, security, accessibility, and design — that can be compared side by side, plus an overall view. The report bundles scores, supporting evidence, prioritized fixes, and insights into one shareable audit report. Results are organized into three action-ready views: Fixes, which shows what is costing points, why it matters, and what to change first, ordered by impact; Opportunities, which surfaces high-leverage ways to improve visibility, trust, usability, and conversion beyond failed checks; and Insights, which explains what the page already does well, backed by rendered checks, schema, previews, and page signals. The SEO, AEO, and GEO portion of the audit covers technical SEO and answer-engine readiness. It reviews titles, meta descriptions, headings, canonical tags, robots.txt, sitemap.xml, structured data, Open Graph, internal links, llms.txt, and answer-ready page structure. The stated goal is to see whether the site is structured for search engines and AI answer systems to understand it. Pro extends this into site-wide AI visibility, where FreeScan.app looks for crawler blocks, content gaps, and citation-readiness issues across scanned pages, showing what needs attention for search and AI discovery. For teams tracking how generative and answer engines surface their content, these checks translate directly into specific pages and specific problems rather than a general recommendation to improve SEO. The security checks look at public website signals visible from the page: HTTPS, mixed-content indicators, common public security headers, insecure forms, sensitive file exposure, and cookie flags. The accessibility fundamentals check finds missing alt text, form labels, heading-order problems, landmark gaps, unclear controls, language issues, contrast risks, small tap targets, and rendered accessibility errors. The design evaluation is conversion-focused, assessing hero and CTA clarity, content density, trust signals, mobile viewport setup, readability, spacing, visual hierarchy, runtime health, performance, and layout stability. FreeScan.app is explicit that this is a focused public-page audit and not a replacement for expert SEO strategy, penetration testing, accessibility certification, or analytics, so the checks should be read as signals and starting points rather than formal certification. The methodology centers on evidence over totals. Instead of returning a single number, FreeScan.app attaches supporting evidence to each finding, explains why it matters, and states how to fix it — the site describes this as turning audit results into clear next steps. Findings are ordered by impact so the highest-value work is visible first, and the report includes practical next steps for every result, along with opportunities and insights derived from rendered checks, schema, previews, and page signals. Because the output is framed as fixes plus explanations rather than vague advice, results can be handed to a coding agent. Builders in community testimonials describe running a scan, giving the results URL to their agent, reviewing the pull request, and shipping — with accessibility scores moving from 72 to 100, or an overall page score going from 40 to 86 after working the list. FreeScan Pro is a single plan at $19 per month, cancellable at any time, that moves from a single page to the whole site. Pro runs automated site-wide audits and organizes results into SEO, AI Visibility, and Fixes workspaces in one private dashboard. A site-wide fix board groups findings from across the site into a prioritized board where you can see affected pages, track each fix, and give your agent the evidence to act. Agent workspaces let you export full SEO, AI Visibility, and Fixes workspaces as Markdown, and Pro MCP lets a coding agent read private findings and request rescans. Pro also audits key pages automatically each week, sends email reports, compares progress, monitors uptime, and supports an optional shareable status page. Stated limits include up to 60 baseline and 25 recurring pages, five sites, and five manual scans per week per site. FreeScan.app also publishes a leaderboard of the highest scoring Pro homepages, ranked by each website's latest homepage audit. Users come to FreeScan.app to find out what a page is missing and exactly what to fix. The stated outcomes are improved search rankings, AI visibility, user trust, and conversions. Because each failed check includes evidence and a concrete fix, teams can turn audit output into a work list — one testimonial describes shipping against the list like a sprint backlog and reaching 100 out of 100 across SEO/AEO, security, accessibility, and design. Pro adds tracking so you can see what improves and catch new issues as the site changes, with weekly audits, progress comparisons, uptime monitoring, and downtime alerts. Public, shareable audit reports also make it easy to show progress before and after a fix cycle. Together these turn a one-time score into an ongoing improvement loop for visibility and trust. The most obvious use case is running the free audit before a launch, campaign, or SEO push, so you do not guess whether a page is crawlable, secure, accessible, and ready to convert. Another is remediation with coding agents: scan a page, hand the findings or the results URL to an agent such as Claude Code, apply the suggested fix, and rescan to confirm. Teams also use it to check a single public URL for SEO, security, accessibility, and design issues and see what to fix first, and to review answer-engine and AI visibility signals such as llms.txt, structured data, and crawler access. For ongoing operations, Pro supports weekly site-wide audits of key pages, a fix board for tracking work across the site, and uptime monitoring with a shareable status page. FreeScan.app also publishes practical guides on website audit checklists, technical SEO audits, and auditing a SaaS website safely. The product targets builders, developers, indie makers, and website owners who ship sites and want fast, evidence-backed feedback, including teams working with coding agents. The audit is a web-based, public-page tool: you paste a URL and it scans, with no signup required for the free check. Pro is priced at $19 per month with cancellation at any time and covers up to 60 baseline and 25 recurring pages, five sites, and five manual scans per week per site. Integration points explicitly described are Markdown export of SEO, AI Visibility, and Fixes workspaces, connection through Pro MCP so agents can read private findings and request rescans, weekly email reports, and an optional shareable status page. The site also notes the tool complements rather than replaces expert SEO strategy, penetration testing, accessibility certification, and analytics. FreeScan.app gives anyone a fast, free way to see what a public page is missing across SEO, AEO, GEO, security, accessibility, and design, and exactly what to fix first. The free 40-check audit runs without signup and returns four category scores, prioritized fixes, opportunities, and insights in one shareable report. Pro at $19 per month turns that into whole-site monitoring: automated weekly audits, a unified fix board, agent workspaces and MCP access, private scan history, and uptime monitoring with status pages. For builders who need to know whether a page is crawlable, secure, accessible, and ready to convert — and who want evidence they can hand straight to a coding agent — FreeScan.app packages discovery, diagnosis, and next steps into one workspace.
AI Observability by OpenObserve is an AI and LLM monitoring product that traces every agent, tool call, and model request, scores quality on live traffic, and attributes cost to the token. It runs in the same platform that handles the rest of a team's production stack, is OpenTelemetry-native, can be deployed anywhere, and is priced per GB instead of per span. Its stated purpose is to show what agents are really doing: every agent session is traced across models, tools, services, datastores, and user sessions so teams can see exactly where time, money, and quality went. It is aimed at the people who operate agentic applications in production — developers, platform and SRE teams — and it also extends to evaluation and AI SRE workflows. The problem it addresses is that agentic applications are expensive and opaque. As OpenObserve frames it: your agent cost $40 and took 34 seconds — but why? A single request fans out into hundreds of spans, and most LLM tools are a silo bolted onto a real observability stack, metered per span and locked to one cloud. That metering model punishes exactly the workloads agentic apps create. Meanwhile, debugging a bad answer often means grepping logs to reconstruct what an agent did. OpenObserve positions itself as one platform for AI and everything under it: LLM traces land next to logs, metrics, traces, and RUM, so when an agent is slow you can see the pod, database, or vector store behind it — no second tool, no swivel-chair. Tracing and mapping work by treating every agent request as a distributed trace. OpenObserve maps each agent to the models, tools, services, and datastores it calls, with request counts and error health on every edge, so a runaway loop or failing tool is obvious at a glance. The Agent Graph renders the full call tree across sub-agents, tools, and models; border colors flag healthy, degraded, and critical paths by error rate; and filters by environment, agent, and version let teams compare releases. Session debugging opens any session and replays the whole conversation — every turn, every tool call, the model behind it, and where cost and latency actually went. Session ribbons break down cost, duration, and tokens per turn; tool, cost, and latency hotspots surface the expensive, slow steps instantly; and one hop takes you from a turn to its full distributed trace. Evaluations run continuously on production traffic. Online eval jobs score live spans, traces, or full sessions the moment they arrive, using LLM-as-judge with your own provider or a remote HTTP scorer. Built-in scorers cover relevance, hallucination, toxicity, bias, and more. You define a score config with a healthy threshold, choose a sampling rate — on a sample or on everything — and score at span, trace, or session scope. Score configs are versioned, and results roll up into a live Quality dashboard that flags what needs attention, replacing the one-off notebook approach to measuring model quality. The evaluation loop closes by turning production traces into test sets. Real traces can be routed into review queues where humans score them alongside the automatic evaluators, with reviewer scores layered over system scores. A single click distills a reviewed trace into a dataset that future versions can be tested against, and Discovery surfaces the failures worth reviewing in the first place. Agent Behavior catches loops and groups failures by kind. Together these steps connect what happens in production to the eval data used to validate the next release. Architecturally, AI and LLM traffic is a first-class layer in one unified stack: it is just another source flowing through the same correlation engine as the frontend, APIs, databases, and infrastructure. Traces, metrics, logs, LLM observability, evals, and AI SRE live in one platform and are queried together with SQL and PromQL. Instrumentation is standard: OpenObserve ingests OpenTelemetry gen_ai spans and OpenInference conventions, so instrumentation you already have keeps working and can be routed to OpenObserve, another backend, or both. The engine is a Rust engine on columnar Parquet storage and bills per GB. Deployments can be managed cloud, self-hosted single binary, bring-your-own-cloud, or bring-your-own-bucket, with federated search across regions and clouds while keeping egress controlled. The outcomes stated in the content are predictability and correlation. Because pricing is per GB ingested and queried rather than per LLM span, per unit, or per seat, agentic applications that fan out into hundreds of spans per request stay predictable instead of spiking the bill, and users are unlimited. Because LLM traces sit beside the rest of the stack, a slow agent can be traced to the pod, database, or vector store behind it without switching tools. Because evaluations run on live traffic against a healthy threshold, quality is watched continuously on a dashboard instead of measured once. Sampling eval jobs and redacting sensitive fields with VRL pipelines before storage help control cost and data exposure. Concrete scenarios include detecting a runaway agent loop: the Agent Graph shows a failing tool or loop at a glance. Replaying a bad answer: a session view shows every turn, every tool call, the model behind it, and where cost and latency went. Comparing releases: filters by environment, agent, and version expose regressions. Measuring quality in production: online evals score live traffic with LLM-as-judge or a remote scorer. Following a failure end to end: from the LLM call through the backend and database, alongside the logs, traces, and metrics from the rest of the production stack. And building eval datasets: routing real traces to annotation queues and distilling reviewed traces into datasets for testing future versions. Target users are teams running agents and LLMs in production — developers, platform and SRE teams, and organizations that need AI observability alongside their existing stack. Integrations are broad and OpenTelemetry-based: OpenAI (Python and JS/TS), OpenAI Assistants, Anthropic (Python and JS/TS), LangChain, Google Gemini, Amazon Bedrock, Mistral, Ollama, DeepSeek, Cohere, Groq, Hugging Face, vLLM, Together AI, Fireworks AI, and xAI Grok, with the FAQ citing coverage of LangChain, CrewAI, LlamaIndex, OpenAI, Anthropic, LiteLLM, and 80+ more frameworks, providers, and gateways. Deployment spans managed cloud in four regions (US East, US West, Europe, India), self-hosted as a single binary, bring-your-own-cloud, and bring-your-own-bucket. Management as code is supported via a Terraform / OpenTofu provider, with enterprise controls including RBAC and SSO. Plans listed include self-hosted Enterprise free up to 50GB, a 14-day cloud free trial, and Enterprise Premium with enterprise-grade support, SSO, and SLAs for large-scale, multi-region deployments. In summary, AI Observability by OpenObserve answers the question of how an agent run accumulated its cost, latency, and quality. It traces every agent, tool call, and model request with OpenTelemetry, evaluates live traffic, and correlates cost per token with the rest of production — one platform, deployable on your terms, priced per GB.
AdScope is a read-only reporting dashboard that pulls Meta Ads and Google Ads into one dashboard simple enough to read on a phone. It shows what you spent, what that spend got you, and every live Meta ad sitting right next to its own numbers. The product is aimed at business owners, marketers, freelancers and agencies who run paid campaigns and want a clear answer to whether their advertising is working. Its stated purpose is total transparency for business owners and peace of mind for marketers: instead of decoding spreadsheets and platform exports, users open one view that combines spend and results across two platforms and shows the actual creatives behind the numbers. Ad reporting is usually fragmented. Advertisers run Facebook in one tab and Google in another, do the math in their heads, and rely on yesterday's hand-built export that is already out of date. Setting up that kind of view takes hours before a single number appears, and even then a row label such as final-3-copy tells you nothing about which creative actually won. AdScope's premise, as stated on its site, is that you already paid for this data, so it should be in one place, by platform, by campaign and by ad. The product targets that gap with live sync and a mobile-first view, so the answer is available before the first coffee rather than after a manual export. AdScope's Visual Ad Gallery shows every live Meta image and video ad you are running next to what it spent and what each result cost. Rather than reading a row labelled with an internal file name, you see the creative itself and can recognise the winner immediately. This matters because the creative is usually what separates a campaign that works from one that does not, yet many reporting views strip the creative out and leave only metrics. By pairing the live ad with its own cost per result, AdScope lets users judge performance visually and act on it, and because the gallery reflects live ads, what appears on screen matches what is currently running. The Bottom Line combines total daily spend and results, whether leads or sales, from Meta and Google into one single view, so users no longer have to do the math in their heads or stitch together two platform exports. From there, performance can be broken down by campaign or by ad in one click, so users can track exactly where their budget is working. AdScope also provides platform data breakdown and full date range control, meaning users can look at a specific window rather than being locked into a fixed rolling period. Real-time tracking keeps the numbers current, so the dashboard reflects what is happening now rather than what happened before the last manual export. Together these capabilities answer the recurring question of which dollars actually produced results. Connecting is deliberately minimal. Users log in with their existing Meta and Google accounts, the same way they log into Facebook, and the dashboard builds itself in seconds. There is no pixel, no tracking code, no developer and no data mapping required, and AdScope syncs every Google Ads account so that every campaign and vital metric is tracked in one place. Meta connects in one click and surfaces campaign performance, live creatives, lead count and cost per lead. Access is read-only through the official, verified APIs from Meta and Google. AdScope can display ad data but can never edit, pause or change a live campaign, and it cannot spend any of the user's budget. AdScope is a mobile-first responsive web app with nothing to install. The site's stated intent is that you open it in your browser at 7am and see what yesterday cost you, before you open the laptop. That framing matters for advertisers who check performance in short windows through the day rather than sitting down at a desktop to configure reports, and mobile app access is listed as part of the Business Plan. Alongside the dashboard, Instant Lead Access shows who is interested in real time and lets users trace each lead back to the exact ad that captured it. Instead of treating lead data as a separate export, AdScope keeps acquisition and follow-up in the same place. AdScope's distinctive approach is adaptation during onboarding. When a user creates an account, they define their business type, for example ecommerce or lead generation, and the main overview adapts instantly to that choice. Campaign metrics also adjust dynamically based on campaign type. That means the dashboard does not present one generic template to every advertiser; instead the numbers shown are the ones relevant to how that account's campaigns are actually optimised. AdScope reports on whatever the campaigns optimise for, including leads, calls, messages, form fills or purchases. The company is explicit that it is not an ecommerce attribution engine and that it does not do blended ROAS modeling. The outcome AdScope promises is transparency and peace of mind: total transparency for business owners and peace of mind for marketers. Because the platform is read-only, connecting an account carries no risk that a live campaign will be changed or that budget will be spent, which lowers the barrier to trying it. The Visual Ad Gallery turns performance review into recognition rather than decoding, and the unified spend-and-results view removes mental math. For marketers managing company or client accounts, the dashboard produces an answer in seconds, matching the tagline of understanding ad performance in seconds, and the company describes the goal as understanding your ad performance in five seconds. Concrete scenarios follow directly from that design. A business owner opens the mobile dashboard at 7am to see what yesterday cost across Meta and Google before starting the day. A marketer reviewing creative scans the Visual Ad Gallery, spots the live ad with the lowest cost per result, and shifts attention to it. Someone handling lead follow-up opens Instant Lead Access, sees who is interested in real time, and traces each lead back to the exact ad that captured it. A buyer deciding where budget belongs breaks performance down by campaign or by ad in one click and compares the two platforms side by side. During onboarding, an ecommerce or lead generation business picks its type and watches the overview adapt immediately to how its campaigns are optimised. AdScope is built for two broad groups: business owners and marketers running their own ad accounts, and agencies and freelancers running client accounts. The Business Plan covers the first group and lists one user per workspace, connect all major platforms, a unified real-time dashboard, real-time tracking, the Visual Ad Gallery, platform data breakdown, mobile app access, full date range control and standard support by email only. Pricing starts with a 10-day trial and no card required until the dashboard is built, then $9.99 per month locked for 12 months; after the first year the rate moves to $39.99 per month. Annual billing is $99.90 per year for the first year, then $288 per year. An Agency Plan with client workspaces, white-label reports and client dashboard access is in design and not yet available, and TikTok Ads is listed as coming soon. AdScope's value proposition is narrow and clear: take the Meta and Google ad data a business already paid for, display it in one live, mobile-readable view, and put the actual creative next to the numbers that matter. Read-only access through official APIs removes setup friction and risk, onboarding adapts the dashboard to the business type and campaign type, and the Visual Ad Gallery plus the combined spend-and-results view replace spreadsheet math with instant recognition. It is not an attribution engine or a ROAS model; it is the reporting layer that answers, in seconds, what you spent, what it got you, and which ad did it.

Sleek Analytics is a privacy-first Google Analytics alternative for the modern web. It provides real-time website analytics with cookieless tracking and fast dashboards. The product offers real-time website analytics, cookieless tracking, and fast dashboards. It includes real-time visitor tracking and a live globe view to watch visitors arrive as they happen. The tool supports referrer and UTM tracking without cookies and uses multiple bot detection methods to keep reports clean while remaining privacy-friendly. Implementation is simple, requiring users to paste one line of code to start watching real visitors on their site live, with zero cookies and zero consent banners. The main benefits are simplicity, privacy-friendliness, and real-time data without adding unnecessary tracking, cookie banners, or a huge analytics setup. It provides clear, fast, understandable data for website owners. The target users are website owners who need clear, fast, understandable data without unnecessary tracking or cookie banners. It integrates with websites through a single line of code.

Exstats is a platform that unifies browser extension analytics and market research across Chrome, Edge, and Firefox. It addresses the problem of fragmented data across different extension stores, making it difficult for builders to understand product performance, competitor activity, keyword relevance, and market changes. The main purpose is to bring all this information into one unified view for better market visibility. Key features include the ability to track your own extensions across Chrome, Edge, and Firefox. You can monitor competitors, including their ratings, reviews, rankings, and keyword positions. The platform provides access to explore over 280,000 browser extensions with advanced filters. Users can follow store and category trends to understand market movements. Additional capabilities include receiving daily updates on metrics, the ability to export data, and configurable alert systems. The platform keeps historical snapshots of data, allowing users to see trends over time for ratings, installs, users, and rankings. It pulls reviews into a unified view across all stores, eliminating the need to check each listing manually. The product works by collecting data from public extension store listings. Crawlers run once a day after midnight UTC to gather daily snapshots, keeping updates consistent and comparable. The approach normalizes data where fair comparison is possible, though it provides context for differences between stores, such as Chrome showing weekly users, Firefox having average daily users, and Edge being closer to installs/users. Benefits include saving time by eliminating manual checking across multiple stores. It provides better visibility into the extension market for product development and growth strategies. Use cases involve tracking extension performance, conducting competitor analysis, monitoring keyword positions, and observing store trends to inform business decisions. The target users are extension founders, indie makers, agencies, and teams that want better visibility into their market. It is built for anyone building or growing browser extensions. The platform covers Chrome Web Store, Firefox AMO (Add-ons), and Microsoft Edge Add-ons, providing a comprehensive cross-store analytics solution.