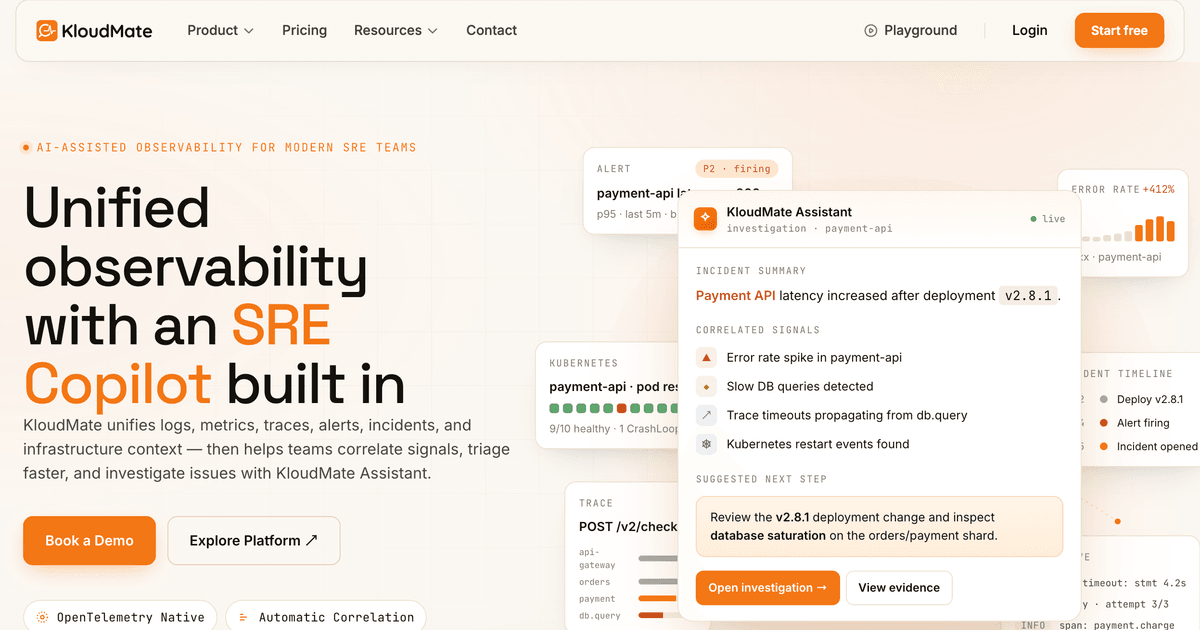
KloudMate is an AI-powered, full-stack observability and SRE-ops platform that brings logs, metrics, and traces together in a single place so engineers can find and fix production issues without jumping between tools. Its headline promise is unified observability with an SRE Copilot built in: rather than treating telemetry as separate silos, KloudMate connects alerts, signals, incidents, and infrastructure context into one investigation flow. The platform pairs a complete observability stack — log management, infrastructure monitoring, APM and distributed tracing, alerting, incident and on-call management, synthetic monitoring, and Kubernetes and infrastructure monitoring — with KloudMate Assistant, an AI module that summarizes, correlates, and guides response workflows. KloudMate is described as built for modern, distributed systems and is aimed at SRE and platform teams who need production visibility from telemetry collection through to incident response.
The investigation problem KloudMate targets is simple to state and painful to live with: every signal lives in a different tool, so every incident becomes a manual hunt. Alerts tell you something is wrong, while logs, metrics, traces, incidents, and infrastructure events tell you why — but only when a team can connect them quickly. KloudMate describes three concrete symptoms of this fragmentation. First, signals are scattered: teams jump between dashboards, alert channels, logs, traces, and infrastructure views just to understand what changed. Second, triage takes too long: every incident begins with manual correlation, noisy alerts, and repeated context gathering across tools. Third, costs keep growing: as telemetry volume increases, fragmented observability stacks become harder to manage and more expensive to operate. KloudMate's answer is to bring these signals together and use KloudMate Assistant to surface context, correlations, and next steps during investigation.
KloudMate Assistant is the platform's SRE Copilot, designed to move teams from alert to evidence faster. It correlates telemetry, summarizes incident context, highlights likely causes, and guides engineers toward the next useful investigation step. The Assistant's documented capabilities include automatic correlation — connecting alerts with related logs, traces, metrics, infrastructure signals, deployments, and incident activity — and AI-assisted triage, which summarizes what happened, what changed, and which signals are most relevant before engineers start digging. Guided investigation then helps teams identify where to look next using telemetry-backed context instead of guesswork, and the module also works to reduce alert noise by grouping related signals and incidents so teams can focus on the underlying issue rather than every symptom. A representative Assistant output shows an incident summary for a Payment API latency increase after a deployment, listing correlated signals such as an error-rate spike, slow database queries, trace timeouts propagating from the database query layer, and Kubernetes restart events, followed by a suggested next step to review the deployment change and inspect database saturation.
The telemetry layer underneath the Copilot covers the three pillars of observability. Logs can be searched, filtered, and investigated with context from services, traces, infrastructure, and incidents, so a log line is never examined in isolation. Metrics monitor service health, infrastructure performance, SLOs, and custom metrics at scale. Traces, delivered through KloudMate's APM offering, follow requests across distributed systems to identify latency, errors, and dependency issues, and let engineers move between related telemetry signals during an investigation without losing service, request, or incident context. The product illustrates this with a checkout trace showing a total duration of 1.84 seconds across 27 spans with one error, breaking down time across a frontend proxy, a checkout API handler, a Redis cart lookup, an inventory API call, a PostgreSQL SELECT for items, a payments API charge, and a Kafka publish — exactly the kind of end-to-end view needed to see where latency actually lives.
Beyond raw telemetry, KloudMate covers the operational workflows around it. Alerting lets teams build workflows that connect symptoms to context and route them to the right responder. Incident management and on-call handles routing alerts to whoever is on call, paging them by phone until someone acknowledges, escalating through further steps when there is no response, and keeping customers posted with a status page. The site illustrates this with an incident timeline: an alert page goes to the primary on-call engineer, goes unanswered, is re-escalated to the second step with additional engineers rung by phone, and is finally acknowledged when one of them presses a key on the call. Synthetic monitoring tracks user-facing availability and performance before customers report issues, adding an outside-in check on top of internal telemetry.
Kubernetes and infrastructure monitoring gives teams a view of cluster, node, pod, and workload health alongside application telemetry, so infrastructure events — such as pod restarts and OOM-kill spikes — can be read in the same context as service errors. The overall investigation workflow ties the pieces together in five steps: an alert is triggered when KloudMate detects abnormal latency, error rate, resource saturation, or availability impact; signals are correlated as KloudMate links the alert with related logs, traces, metrics, infrastructure events, and incident activity; the Assistant summarizes context by highlighting what changed, what is affected, and which evidence matters most; the team investigates faster starting from a focused investigation path instead of manually searching across disconnected tools; and the response stays connected, with findings, ownership, timelines, and follow-up actions remaining tied to the incident context.
The stated benefits centre on consolidation and predictability. KloudMate helps teams consolidate telemetry, alerting, incidents, and investigation workflows into one platform, reducing tool sprawl and lowering operational overhead while keeping observability costs predictable as telemetry volume grows. Being OpenTelemetry native means teams collect telemetry using open standards and avoid lock-in to proprietary agents. Cost efficiency is described as a platform design principle rather than an afterthought, and the platform's production-readiness is framed around real-time signal collection, on-call paging and re-escalation, and a workflow tuned for live incident response. Together these translate into less manual investigation time, one place to look during an incident, and a stack that scales economically with telemetry growth.
Concrete scenarios described in the content include investigating a latency regression: an engineer asks why p99 latency on checkout jumped after a specific time, and the Assistant points to the inventory API deployment that landed minutes earlier, notes that the added latency sits on PostgreSQL SELECT spans inside a stock-lookup call, and suggests opening the relevant trace cluster and comparing database statements across versions. Another scenario is a payment API incident where an alert fires on p95 latency breaching its SLO and error rates climbing, and the Assistant assembles an incident timeline covering the deployment, the alert, and the opened incident along with correlated signals and a suggested next step. Other workflows include paging and re-escalating to on-call engineers until an incident is acknowledged, monitoring Kubernetes workloads for restarts and OOM kills, and tracking user-facing availability with synthetic checks. Teams also use KloudMate to consolidate fragmented logging, metrics, tracing, and incident tooling.
KloudMate is built for modern SRE and platform teams operating distributed systems in production; the site shows engineers from companies including SprintMoney, Rocketium, Codeifai, Ostrum, Soffit, Microsoft, WeCheer, HealthifyMe, and Smartbox. On the technology side, the platform is OpenTelemetry native for telemetry collection and designed for Kubernetes, covering services, pods, nodes, clusters, workloads, and application telemetry together. The Product Hunt listing notes that KloudMate originally launched three years earlier as an AWS serverless monitoring tool and returns as a full-stack, AI-powered observability and agentic SRE-ops platform, with AI modules comprising Assistant (Answers), Builder (Dashboards, Alarms), Investigator (RCA), and Docs (Documentation). Access to the product is offered through a demo booking and an exploratory demo environment rather than a published self-serve pricing page.
KloudMate's value proposition is straightforward: unify the signals that describe production, put an AI SRE Copilot inside the investigation workflow, and let teams move from alert to root cause without switching tools. By connecting logs, metrics, traces, alerts, incidents, synthetics, and Kubernetes and infrastructure context in one platform — and by using KloudMate Assistant to correlate evidence, summarize context, and suggest next steps — it aims to shorten incident triage, cut manual correlation work, and keep observability costs predictable as telemetry grows.
Publisher
A
admin
Launch Date2026-10-09
Platformweb
Pricingfree
Tech Stack
#OpenTelemetry#Kubernetes
Traffic Insights
Month2026-10
Estimated Visits4.5K
MoM Visits GrowthN/A
Avg Time on Site-
MoM Time GrowthN/A