Category Focus/categories/analytics
Analytics AI Tools
Discover and compare the best analytics AI tools and software. Browse 115+ curated tools with reviews and rankings.
Projects tracked
115
Sort mode
RECENT
Page
1
Discover and compare the best analytics AI tools and software. Browse 115+ curated tools with reviews and rankings.
Projects tracked
115
Sort mode
RECENT
Page
1
Proofsource is an AI intelligence platform that shows whether ChatGPT, Perplexity, Claude and Google AI Overviews name your brand, who they name instead, which sources they cite, and what to fix. Its stated purpose is to make the AI shortlist visible day by day and engine by engine, and then to close the gaps behind every lost answer. The site names four audiences it is built for: growth and brand leaders, writers and search teams, agencies running many brands, and founders and small businesses. Rather than stopping at a visibility score, Proofsource continues through to drafted fixes drawn from your own content, so a gap in an AI answer becomes a change you approve and publish. Buyers now ask AI for a shortlist. An answer engine names three to five brands and moves on, and if your brand is not one of them there is no second page to rank on and no click to measure. Proofsource's own published measurement illustrates how contested that shortlist is: across 947 citations and four engines, 43.5% of the sources AI cited for category questions were comparison pages — listicles, alternatives and versus pages. In the same scan, 387 different websites were cited across just 80 answers, meaning your own site is one voice among hundreds. A separate branded-question read, done by hand, found that only one of four engines described a brand-new company correctly, while the other three answered from what they already believed. The company also published research stating that 0.8% of AI citations point to the brand's own website. These findings explain why Proofsource argues that rank trackers, which measure blue links, do not answer the question of whether an answer engine recommends you. The core visibility layer answers the first question: are you in the answer? For each brand, Proofsource reports mention rate, share of voice and average position per engine, so you can see the share of buyer answers that name you, how large your share of the named brands is, and where you typically appear. Every number carries a 95% confidence range — the site specifies a 95% Wilson interval — so a bad day never looks like a trend. The platform keeps the full text and a screenshot of every answer, which means a visibility claim can be traced back to the actual engine response rather than a summary score. On paid plans the questions are asked every day, because AI answers shift from day to day and a weekly snapshot can miss the day a competitor enters your shortlist. The free trial runs two scans, today and tomorrow, covering 25 questions on every engine for 200 answers in total. Once visibility is measured, Proofsource surfaces who AI names instead of you. Every brand the engines name for your questions lands on a single leaderboard, ranked by answers and broken out per engine, including brands you never thought of as competitors. Any of them can be added to tracking with one click, so the competitive set grows as the engines reveal it, and the leaderboard shows the specific questions where each competitor beats you. The citation layer then explains why: answers are built from sources, so Proofsource lists every page the engines cite for your questions, which cited pages mention you, and which are open to a pitch, a listing or a correction. It flags cited domains and exact pages, listicles that leave you out, and the pages on your own site that engines read versus the ones they skip. In the Tesla example shown on the site, youtube.com was cited in 29 answers, en.wikipedia.org in 24, reddit.com in 20 and tesla.com in 17 — the first naming Tesla outright, the next two naming it partly, and the last being the brand's own site. Proofsource also checks what the engines get wrong about you. Because engines answer from what they already believe, the platform asks about your brand by name, reads the answers, and flags wrong prices, old features and mixed-up identities, with the source behind each claim. An illustrative claim check on the site shows an engine reporting a price the brand retired last year and a free tier that does not exist, tracing it to a 2024 review page, and suggesting an update to the pricing page plus a request for the reviewer to refresh. Profile checks run on the sites engines lean on, and the platform audits crawler access — whether GPTBot, ClaudeBot and PerplexityBot can read you at all. When gaps are found, Proofsource ranks them by likely lift against effort, names the page or source to change, and drafts the fix from your own content for you to approve. The Product Hunt listing describes the final step: agents publish the approved changes, verify that the answers changed, and learn from every change. Proofsource describes one loop from the answer to the fix, summarised as Know, Act, Prove, Repeat. Most AI visibility tools stop at a score; Proofsource continues through what the engines say, why they say it, what to change, and whether the change worked. Onboarding follows a three-step path. First, you tell Proofsource your site; it reads it, works out your category and your competitors, and drafts the buyer questions worth tracking, and you approve every one. Second, the platform asks the engines those questions, keeping every answer with its sources and a screenshot. Third, you get the shortlist and the fixes: where you are named, who is named instead, which sources decided it, and the gaps worth closing first. The site also publishes a methodology page describing how it measures AI answers. For growth and brand leaders, Proofsource offers one number for AI visibility that can be defended in a board meeting, with the questions, engines and confidence range behind it. For writers and search teams, it supplies the questions you lose, the pages the engines cite instead, and drafts grounded in your own site — as the site puts it, search taught you to rank, this shows you how to be quoted. For agencies running many brands, the platform supports unlimited brands on one account, a weekly report per client, and a roll-up of who is winning and losing across the book. For founders and small businesses, the free trial gives 200 answers over two days with no card, so you can see in minutes whether ChatGPT recommends you and then fix the one page that matters most. Because each brand chooses how many questions it tracks, spend can be tied to the brands that earn their place. Concrete workflows follow directly from those roles. A founder can run a free scan before a launch, check whether ChatGPT names the company for its category questions, and start with the single highest-value page to change. A search or content team can look at the citation list, find a listicle that leaves the brand out, and pitch a listing or a correction on that cited page. A brand can run accuracy checks, discover that an engine is quoting a retired price from an old review, and draft a fix plus a reviewer refresh request. An agency can scan each client brand, send a weekly report per client, and roll up the results to see which brands are winning across its whole book. A growth lead can bring a mention rate with a confidence range, backed by the questions and engines behind it, into a board discussion about AI visibility. Proofsource tracks ChatGPT, Perplexity, Claude and Google AI Overviews on every plan, with Grok and DeepSeek available as add-ons on Custom plans. The site's logo strips also display Google AI Mode, Gemini, Microsoft Copilot and Meta AI. The free trial is described as 200 answers, 25 prompts per question, top AI engines, two days, free, and no card, with two scans — today and tomorrow. After that, custom plans start at $64 per brand per month, with the final price discussed on a demo call, and each brand chooses how many questions it tracks. The site also publishes side-by-side comparison pages against Profound, Otterly.AI, Peec AI, Semrush, Ahrefs, Scrunch, SE Ranking, Rankscale and AthenaHQ, covering engines covered, sampling cadence, statistics, fixes and price, with sources for every claim about another product. The shortlist for your category is being written right now by answer engines, and most brands never see it. Proofsource's value proposition is that it makes that shortlist visible — who is named, who is named instead, which sources decided it — and then keeps going with ranked gaps, drafted fixes drawn from your own content, and verification that the answers actually changed. Start free with 200 answers, 25 questions on every engine, and no card, and find out whether AI names your brand.
Alkera is an agentic data platform that brings data engineering, analysis, and science into collaborative multiplayer workspaces shared by both humans and agents. The product is also known through Databench by Alkera, described on Product Hunt as the open-source, multiplayer workspace for data science, analytics, and engineering. Its stated purpose is to cover an entire data stack within one agentic platform, letting data teams collaborate live alongside teammates and agents in notebooks and chats, run any cell or agent on a laptop, another computer, or a GPU node, launch many agents in parallel to explore ideas, and trace every result back to the data and code behind it. Alkera presents itself with a single headline: 'One agentic platform. Your entire data stack.' The three disciplines it names — data engineering, analysis, and science — have historically been handled in separate tools and by separate specialists. Alkera's stated approach is to place all three in shared, multiplayer workspaces where humans and agents work together rather than in isolation. The platform leans heavily on two related concerns. The first is trust: the Product Hunt description states that every result traces back to the data and code behind it, and the site demonstrates column-level lineage across warehouse, transformation, and analysis layers, plus knowledge entries that display their sources and whether they are human-verified. The second is safety: Alkera demonstrates testing changes safely in sandbox environments, so edits to pipelines can be examined before they are relied upon. The marketing language around the product frames these qualities as confidence and speed for an agentic data stack. The core surface for this collaboration is the notebook and the chat. In the demonstration shown on the Alkera homepage, a user named Priya asks a Signals agent, 'Can you chart monthly revenue by segment for this year?' The agent reports that it used two notebook tools and ran q3-revenue.alknb.py, three cells, finished. A second teammate, Marcus, then asks whether the analysis can be split by region as well; the dbt agent replies that it is adding a region facet to the trend chart and reports editing q3-revenue.alknb.py, one cell. The resulting chart is titled 'Monthly revenue by segment,' uses month, revenue, and segment fields, includes a tooltip and a facet, and renders enterprise, mid-market, and SMB series across the months of the year. Notebooks therefore appear as ordinary files in the workspace with an .alknb.py extension, and both humans and agents can read and modify them in the same live session. Alkera maintains a dedicated features page for notebooks and dashboards, indicating that dashboards are a first-class part of the same workspace. Agents in Alkera are not confined to a hosted environment. The Product Hunt description states that a user can run any cell or agent on their laptop, another computer, or a GPU node, and launch many agents in parallel to explore ideas. The homepage illustrates this with a training notebook that builds a Llama-style model configuration — hidden size 2048, 24 hidden layers, 16 attention heads, and a maximum position embedding of 4096 — wraps it in FSDP with a bf16 mixed-precision policy, and runs a training loop with gradient clipping and a scheduler, charting pretraining loss against tokens for train and validation splits on 8x NVIDIA B200 hardware. The same interface shows which model powers an agent: the chat panel displays Claude Opus with a 'High' setting and an 'Ask first' permission mode, and agent messages carry small indicators of what the agent did, such as using two notebook tools, running three cells, or editing one cell. Trust in results is a recurring theme. Alkera's stated position is that every result traces back to the data and code behind it. The site demonstrates column-level lineage across warehouse, transformation, and analysis, which lets a reader follow a column from where it is stored, through the transformation that produced it, into the analysis that consumes it. The knowledge base behaves similarly: each knowledge entry shows its sources and whether it is human-verified, so a reader can see not just the answer but where it came from and whether a person has vouched for it. Alongside these, Alkera demonstrates testing changes safely in sandbox environments, giving teams a way to try modifications without committing them to the live stack. Together these features form a provenance story in which code, data, and knowledge all carry visible evidence of their origin. Alkera's distinguishing approach is to treat agents as first-class participants in the data workspace rather than as a separate assistant window. Agents are given notebook tools, so they can run cells, edit files, and generate charts directly inside the same document a human is working in. The charting interface shown on the homepage, alkera.chart(revenue).line(x='yearmonth(month)', y='sum(revenue)', color='segment').title('Monthly revenue by segment').tooltip().facet('region'), illustrates the style: concise, chainable methods for line charts, titles, tooltips, and faceting. Because agents act on the notebook itself, their work is visible and reviewable in the same place as a teammate's. The platform is also designed to sit on top of the tools a team already uses. Alkera publishes a plugins and connections reference and lists supported systems spanning orchestration, transformation, analytics databases, lakehouses, data warehouses, query engines, business intelligence, knowledge sources, issue tracking, observability, data ingestion, code and CI/CD, communication, and object storage. The benefits Alkera describes center on confidence and speed. Speed comes from parallel exploration: many agents can be launched at once to investigate ideas, and individual cells or whole agents can be dispatched to a laptop, another machine, or a GPU node, so heavy work does not block the interactive session. Speed also comes from having teammates and agents in the same notebook and chat, which removes the need to hand results between separate tools. Confidence comes from traceability. Because every result links back to the data and code behind it, and because lineage is exposed at the column level, a reviewer can check how a number was produced rather than accepting it on faith. Knowledge entries that display their sources and verification status serve the same purpose for documentation, and sandbox environments allow changes to be validated before they matter. Concrete scenarios are visible throughout the material. A data team can ask an agent to chart monthly revenue by segment for a year and then extend the same chart with a regional break, which is exactly the sequence demonstrated on the homepage. An engineer can run a distributed training job — the FSDP and B200 example — and watch pretraining loss as training progresses. An analyst investigating a surprising figure can follow column-level lineage back through the transformation layer into the warehouse to find where the value originated. A team planning a pipeline change can rehearse it in a sandbox environment first. Anyone maintaining internal documentation can build a knowledge base whose entries show their sources and whether they have been human-verified. And a team with an existing stack can bring Alkera in alongside the orchestration, warehouse, transformation, and business intelligence tools already in use. Alkera is aimed at data teams: data scientists, analytics and data engineers, and the broader group of people who do data engineering, analysis, and science. Its Product Hunt topics are Open Source, Artificial Intelligence, and Data Science, and because Databench is open source, teams can either use Alkera's hosted offering or host Databench themselves from its GitHub repository. Pricing starts free: the site offers a 'Start for free' call to action, the Product Hunt listing mentions a generous free tier, and there is also an option to book a demo with the founders. The platform runs on the web and is designed to connect to the tools a team already uses, with a published list that includes Airflow, dbt, ClickHouse, Databricks, DuckDB, generic SQL, Google Docs, Linear, MySQL, PostgreSQL, Sigma, Snowflake, Tableau, AWS, BigQuery, Confluence, Datadog, Fivetran, GitHub, Hex, Looker, Notion, Redshift, Slack, SQLite, and Trino. Security, privacy, and terms documentation are published at dedicated links. Alkera's proposition is straightforward: one agentic platform covering an entire data stack, with collaborative multiplayer workspaces where humans and agents share notebooks and chats, agents that can run anywhere from a laptop to a GPU node and in parallel, and results that always trace back to the data and code behind them. For data teams that want the speed of agent-assisted exploration without giving up visibility into how results were produced, that combination of multiplayer collaboration and end-to-end traceability is the core value.
Pheebs is an open-source telemetry tool built by Eversynced to understand how developers work with AI coding agents and what the models they run are costing them. It installs quietly inside the AI coding agents Claude Code, Cursor, and Codex through hooks, capturing lightweight interaction signals: the shape of the session, not its contents. Hooks and OpenTelemetry go in; honest proficiency reads come out. The product is built for teams that want an evidence-based answer to a simple question — how is AI coding actually being used here, and what is it costing? AI coding agents are fast and their output often looks polished, which makes them very hard to assess by feel. Polished output can hide missing verification. Over-provisioned models can burn budget without anyone noticing. Follow-up prompts spent repairing AI-generated breakage can look indistinguishable from healthy iteration unless someone measures them. The site frames this through a set of observations: model spend that buys nothing, where thousands of dollars of last month's model spend went to a bigger model than the work needed; AI code that ships unchallenged, where a majority of AI-written lines in a payments service shipped with no check; AI edits that never had a test, typecheck, or build run behind them; rework hiding inside the speedup, where follow-up prompts were fixing something the AI broke rather than moving the work forward; enablement skills that either caught on weekly or never caught on at all; and teams that never run tests inside the agent loop at all. On that last point the site is explicit — that is a missing harness, not a skills gap, and Pheebs is positioned to help teams tell which situation applies to them. Pheebs works with three coding agents: Claude Code, Cursor, and Codex. The client sits inside each agent via hooks, and the coverage spans 17 event types, from session_started through artifact_found. Events include session starts and ends, prompts, skill and slash-command expansions, sub-agent spawns, tool calls and failures, compaction, and background tasks. A sample Claude Code stream shows the granularity in practice: session_started with a codebase and model, prompt_submitted with a prompt length and intent label, tool_use_completed entries for an Edit and a Bash test run, context_compacted with a trigger type, and turn_ended with a background task count. Cursor connects through hooks, while Claude Code and Codex connect through hooks plus OpenTelemetry. Every field Pheebs records is deliberately lightweight, and the tool is explicit about what it never captures. Source code and file contents are never stored. File paths and directory structures are excluded, with a repository recorded only as org/repo from the git remote. Prompt text is never stored — a prompt becomes a character count, with an intent label added when the prompt intent classifier is enabled. Command strings are read in process, so npm test is recorded as tool_intent: test_run rather than as text. Names and emails are avoided: a developer is the id behind their Pheebs token, stamped by the backend, or a truncated hash of their git email when no token is set, and a GitHub handle is never looked up. The site sums it up bluntly: no code, no file paths, no stored prompt text — the shape of the session, never its contents. The capture pipeline is documented step by step. First, a hook fires. Second, lightweight fields are extracted: event type, durations, counts, models, and trigger types, with a prompt reduced to a character count and, when the prompt intent classifier is enabled, an intent label — the text itself is never stored. Third, identity and repo are resolved, using the developer id behind the token or a truncated hash of the git email, and the codebase as org/repo from the git remote. Fourth, every event is stored in a local JSONL log, and with a token set it also goes to the backend. Fifth, OpenTelemetry rides along: Claude Code and Codex export native OTel metrics and logs through the Pheebs proxy. The client offers four routes to any backend — self-hosted, or managed by Eversynced — and the local JSONL stays the durable copy either way. Configuration is deliberately minimal: set a base-url and set a token. Both need to be set or nothing is posted, and unsetting either one stops sending. The backend contract is documented, with a reference backend available in the Pheebs repo. POST /ingest carries one event envelope per request. POST /validate-token resolves a token to an identity and its consent flags. POST /classify-prompt takes one prompt in and returns one label, and it is the only route that receives raw text. POST /otel/v1/{signal} is an OTLP passthrough, so no observability credential ever ships in the client. GET /insights is optional and covers what one developer can see about their own work. On top of the raw events, Pheebs renders a proficiency model organized into six competency areas. Models covers which models are in play: model choice, effort settings, plan mode, and autonomy modes. Artifacts covers the reusable config that shapes the agent: skills, sub-agents, slash commands, and context files. MCP covers live connections to external systems such as tickets, databases, browsers, and documentation. Evals covers verification wired into the agent loop: tests, typecheck, lint, build, and review passes. Context management covers deliberate use of the context window, including compaction and the save, resume, and clear lifecycle. Orchestration covers more than one agent at a time: sub-agents, parallel work, worktrees, hooks, and plugins. Each competency is tracked in one of three states. Unobserved means the practice never showed up in the window. Adopted means it showed up at least once. Recurring means it showed up in at least three of the last four active weeks. The coverage index summarizes this per engineer as the share of applicable practices at Recurring. Alongside the competencies sit five judgement signals, split between output side and input side. On the output side, verification coverage is the share of AI edits followed by a verification action — a test run, typecheck, lint, build, or a check against a spec. Pushback rate measures how often the engineer challenges AI output instead of accepting it, a signal the site notes collapses exactly when output looks polished. Refinement-to-repair ratio distinguishes whether follow-up prompts refine intent (healthy iteration) or repair breakage (rework). Wholesale-accept rate captures sessions with no pushback, no repair, and no verification, weighted by lines changed — described as the composite red flag of polished output with no questions asked. On the input side, model-fit rate is the share of sessions whose model class matched the size of the work. Model-fit is the one signal with a price attached. A reporting view shows savings opportunity against list-price spend, contrasting the models used with the work as sized, and it carries a coverage breakdown — complete, incomplete, no telemetry, unpriced — because decisions and figures come from complete sessions only. Three principles govern the approach. Tasks are sized: every task prompt gets a scope, from a one-file change to open-ended design, and a session is judged on its hardest prompt. Misses count both ways: an over-provisioned session burns budget silently, while an under-powered one shows up as repair prompts. And Pheebs is an audit, not a router: it never intercepts a prompt or switches a model on anyone's behalf — it reads the gap and prices it, and the decision stays with the team. Reporting built on top of Pheebs renders the model in several views. A practice adoption funnel shows one bar per competency, split by how many engineers have not acted on it, acted once, or acted week after week, with Unobserved and Adopted flagged as the competencies to be intentional about. A practice heatmap puts every engineer against every competency; a cold column means the team is missing the setup and practice for that competency, which is described as a structural fix, while a cold row calls more strongly for coaching. A per-engineer view shows how much of each competency has become habit and sums it up in a coverage index that can be tracked over time. A signals-by-engineer table lists verification, pushback, refine-to-repair, wholesale accept, and model-fit per person alongside a team median. The guidance is direct: one weak number is a coaching conversation, but a weak column across the whole team is a structural gap. The sample views on the site are labeled illustrative data. Pheebs can be deployed in two ways. Self-hosted means you stand up the backend and telemetry goes from your developers' machines to your own infrastructure — Eversynced never sees it. That option includes the full client with all three agents under Apache-2.0, a documented contract and a reference backend in the repo, raw JSONL you can query with whatever you already use, and no account, no key, and no requests from Eversynced. Managed means Eversynced runs it, along with the reporting on top: the same open-source client pointed at an operated backend, with the proficiency model rendered as reports and dashboards. That is the AI Enablement Assessment service — a 30-day telemetry sprint that ends in an executive debrief and a plan for the gaps, including the model-fit gap priced in dollars from the team's real sessions, with insights tracked over time. Installation is a single npm command, followed by pheebs init for interactive setup across all three agents and pheebs doctor to check the wiring. In practice the product serves teams that want to see where AI budget actually goes, teams diagnosing whether weak AI results are a setup problem or a coaching problem, and individual developers who want their own honest read on their practice. Eversynced runs Pheebs on itself: every Eversynced engineer is instrumented with it, and it powers the measurement layer of the company's AI delivery framework, which is the same reporting that ships with the AI Enablement Assessment run for client teams. The takeaway is that Pheebs turns an otherwise invisible activity — how a team works with AI coding agents and what those agents cost — into measured, priced evidence. It does so without storing the work itself, and it leaves every decision with the team: an audit rather than a gatekeeper.
AUDR — Agent Usage Detail Record — is an open standard for recording who initiated an agent run and how much each cost, across every system a run passes through. It defines a common JSON schema that any harness, router, or billing system can emit and ingest, so a single agent run can be represented through records that share a common structure. AUDR was drafted at Chargebee, is licensed under Apache 2.0, and is stewarded by Chargebee, with the stated goal of moving cost governance to an independent foundation as adoption grows. It is useful anywhere you need a reliable record of what an agent run consumed and who or what it was associated with. The problem AUDR addresses is that a single agent run touches multiple systems. The application knows the customer and the feature. The router knows the tokens and the cost. The tools know what they executed. As the project describes it, a run can be fully observable at every individual layer and still leave you without a single end-to-end record of who ran it and what it cost. Without a shared way to join these observations, usage data is orphaned from the business context that gives it meaning. The telecom industry solved an analogous problem with the Call Detail Record, an open standard carriers converged on so a call's attributes could be captured and exchanged in a common format, independent of any single carrier's systems. AUDR is built on the same principle: a common record for agent runs that any harness, router, or billing system can emit and ingest to help businesses make sense of the economics at the run level. AUDR works through three rules. The first is a shared run ID, minted by the harness, passed to the router in request metadata, and echoed back, so that every system that touches the run carries the same ID. The second is clear authority per field: the harness owns attribution — customer, environment, initiator — while the router owns usage — tokens, provider. Each fact has exactly one source. A record carries the raw counts that drive cost, such as tokens, tool calls, and seconds of compute, alongside the business context that says whose cost it is: customer, feature, environment. Every layer keeps reporting what it already reports, and AUDR adds the rules that let those reports come together into one record. The third rule is strict merge rules. The sink assembles records sharing a run and span ID, and no component rewrites another's block. Conflicts are rejected, and a correction is a new record, never a mutation. The documentation illustrates this with a sample record in which run.run_id is "run_8f2a1c" (minted by the harness) and span_id is "span_4b91"; attribution includes a customer_id of "acme-corp" and an initiator of "end_user", both sourced from the harness; usage includes llm input_tokens of 1204 and output_tokens of 318, sourced from the router; and the emitter component is "router". One record, one authoritative source per field. Adapters capture records from the runtime you already use. The Core SDK builds, validates and delivers records straight from your own code, available in Python (audr) and TypeScript (@openaudr/audr), and every adapter and sink builds on it. NVIDIA NeMo Relay records completed LLM and tool scopes, with attribution read from the root scope's metadata (Python, audr-adapter-nemo-relay). LiteLLM registers as a callback on the SDK or Router and records completion, Responses API, embedding and rerank calls (Python, audr-adapter-litellm). Merge Gateway wraps the native SDK client and records every response, streamed or not, using the gateway's own token and cost report (TypeScript, @openaudr/audr-adapter-merge-gateway). Vercel AI SDK registers as an AI SDK 7 telemetry integration and records model, tool, embedding and rerank calls (TypeScript, @openaudr/audr-adapter-vercel-ai). Mastra registers as an observability exporter and records model, embedding and tool calls (TypeScript, @openaudr/audr-adapter-mastra). Adapters read identifiers, usage and timings, never prompts or outputs, and every package is Apache 2.0 and published to PyPI or npm. Sinks deliver records to your destination. The flow is runtime to adapter to core client to sink to destination. The Chargebee sink delivers records to a Chargebee site's usage-ingest batch endpoint for usage-based billing (Python audr-sink-chargebee and TypeScript @openaudr/audr-sink-chargebee), and the Lago sink delivers records to Lago's batch event endpoint for usage-based billing (TypeScript @openaudr/audr-sink-lago). Running something else? The core SDK emits records directly from your own code, and any destination can be reached with a new sink. To try it, you register an adapter with the runtime you already use and get a usage record for every model and tool call, including the customer it belongs to; you can write the records to a local file to start, with no account, hosted backend, or pricing configuration needed. AUDR is designed to sit on top of OpenTelemetry, not compete with it. OTel's GenAI semantic conventions provide the foundation for describing model calls and usage, and AUDR reuses them: an AUDR record can be emitted as an OTel span, and the OTel collector is a first-class sink. What OTel does not define is the set of rules needed when usage becomes a durable record — which attributes are required, how attribution is handled when it is missing, how retries remain idempotent, or how corrections are made. Observability can tolerate a dropped span; a usage record cannot, which is why AUDR adds those requirements and delivery semantics on top. FOCUS solves a different part of the same problem: it standardizes the billing data you receive from providers so costs from AWS, Azure and others can be represented in a common schema, while AUDR standardizes the usage you emit when an agent run happens, before that usage is priced. The two are complementary, and AUDR records can be rated by any backend and mapped into FOCUS-compatible cost data, completing the upstream half of an existing standard. The practical benefit is being able to answer concrete questions about agent economics at the run level. Wrap your router, emit the records, and AUDR can help you answer questions such as: How much does this agentic feature cost? What does this customer's agent usage look like, and how much does it cost? What are the unit economics and margins per customer for my agentic features? Which workflows or models are driving our costs? Which power users are driving our costs? AUDR adds nothing in the normal request path: it emits records asynchronously and out of band, so recording usage does not add synchronous work to inference. The one exception is optional pre-flight budget gating, which would make a single check before a run starts. Because the spec carries no prices or rating logic and the SDK has no concept of plans, invoices, or how a customer should be charged, AUDR records what happened and who it happened for, leaving what you do with that data up to you. You can point the records at Chargebee, a competing rating engine, your own, or a warehouse for analytics, and AUDR works the same way. You do not need a billing system to use it: records can be stored locally, sent to your warehouse, fed into an observability system, or used for internal cost analysis or future projections. A billing system is just one possible consumer of the record. Today five adapters, two sinks and the core SDK are published, in Python, TypeScript or both: adapters for NVIDIA NeMo Relay, LiteLLM, Merge Gateway, Vercel AI SDK and Mastra, and sinks for Chargebee and Lago. Support for OpenRouter is in development. The three rules at the core of AUDR are stable — one run ID across every layer, one authoritative source per field, and strict merging with no silent overwrites — and will not change without a major version, while the field set will continue to grow as providers introduce new things to measure. The project invites involvement: read the spec for the full schema, field ownership rules and delivery semantics; write an adapter for a harness or router not yet reached, which the project describes as roughly 200 lines against the shared fixtures; write a sink for a warehouse, ledger or billing system you already deliver usage to; or open an issue with a specific account of where a design decision breaks. Questions can be sent to audr@chargebee.com. In short, AUDR is an open, Apache 2.0 standard that turns fragmented per-layer observability into one joined record of who initiated an agent run and what it cost, giving teams building and monetizing agents a neutral, vendor-independent foundation for understanding agent economics and cost governance.
DailyHelm is an agentic AI business reviewer that watches a company's analytics, advertising, SEO and store data overnight, then tells the operator what to fix today. Instead of handing over charts that still have to be interpreted, it delivers a prioritized list of fixes ranked by likely revenue impact. It is built for founders and growth teams who run the whole business themselves, the people wearing the marketing hat, the engineering hat and the finance hat at the same time. The promise on its own site is simple: stop guessing what to do next, and start each day with a punch list that points at the issues worth acting on. Traditional dashboards answer the question of what happened but leave the harder question of what to do about it entirely to the person reading them. Founders describe opening five tabs and spending ninety minutes every morning reviewing data while still feeling like they were guessing. Meanwhile, the most expensive problems are silent: conversion tracking that breaks after a deploy so paid ads optimize against zero data, search terms burning budget with no conversions, near-me queries dropping out of the local pack, a best-selling product page returning a 404, a lead form that quietly stops submitting, or a surge in failed payments that churns subscribers for days before anyone notices. DailyHelm exists to surface exactly those kinds of issues and to rank them by the revenue they put at risk. The core of the product is the daily digest. Every morning it greets the user with a business review that states what changed overnight and lists today's recommended actions as a numbered, prioritized punch list. Each item carries an impact score and an effort estimate, so a high-impact, low-effort fix can be separated from lower-priority work. In the example shown on the site, the digest opens with a conversion tracking outage: tracking has been broken for four days and $8,400 of ad spend has been optimizing against zero conversion data. The two recommended actions are to restore GA4 conversion tracking at an impact of 9 out of 10 with low effort, and to pause campaigns until tracking is verified at an impact of 7 out of 10, also low effort. Findings are produced by six specialist AI agents, each of which owns a domain. Iris covers analytics and growth, including funnels, pipeline health and churn signals. Pitch covers ads, including spend, keywords, search terms and CPA. Echo covers SEO, including rankings, indexation and on-page signals. Ada covers code, investigating the repository when business data smells off. Penny covers cost, including cloud spend by SKU, cost forecasts and egress leaks. Sage covers site UX, including crawl-driven performance and conversion blockers. Aria is the lead agent: she correlates the specialists' findings, ranks them by expected impact and writes the morning brief, and she is also the agent users chat with when they want to dig deeper into a finding. Every finding is evidence-backed. A finding lists its impact score, a confidence percentage, an effort rating and the raw evidence behind it, for example a GA4 purchase metric reading zero for the window while Stripe shows 47 successful charges, alongside the specific commit that removed the tracking tag. From there DailyHelm recommends a concrete next action, such as restoring a line of code removed in a named commit and pausing a set of Google Ads campaigns until the next sync confirms tracking is live. Users can accept, snooze or dismiss a finding, or open a chat with Aria to ask what broke and how it slipped through. Findings can also come from more than one specialist at once, for instance Ada and Iris cross-referencing a tracking blackout, or Iris, Ada and Sage teaming up on a lead form regression, which is how a business-data symptom gets traced back to its technical cause. Setup is designed to be quick. Users first describe their business, including what they sell, who buys it and what success looks like, which anchors every later recommendation. They then connect platforms one click at a time: DailyHelm opens the approval page and the user confirms. Supported integrations shown on the site include Google Analytics 4, Google Ads, Google Search Console, Shopify, GitHub, Stripe, Meta Ads and a site crawler, with GCP billing also listed in the connection flow. DailyHelm pulls a daily snapshot from each platform and, in its own words, stores nothing it does not need. The site quotes a setup time of under five minutes on average and says findings start arriving within the hour. Because the product reads advertising, analytics and repository data, DailyHelm makes a point of being safe to plug in. It is read-only on every connector: OAuth scopes across GA4, Search Console, Ads, GitHub and the store are read-only, and the company states it cannot write, post or modify anything in connected accounts. Integrations use OAuth only, with no API keys, so users approve scopes on the platform's own consent screen and can revoke access from either DailyHelm or the platform at any time. Traffic is encrypted with TLS 1.2+, data is encrypted at rest, and OAuth refresh tokens and webhook secrets are encrypted at the field level. The company states that AI processing happens through providers contractually prohibited from training on customer data, and that the service is GDPR and CCPA compliant, with access, correction, export and deletion rights honoured. Deleting an account revokes every connected token, purges findings and removes personal information within 30 days. What makes the approach distinctive is that it is agentic rather than purely analytical. DailyHelm does not simply aggregate metrics into a dashboard; it runs a review, the way a specialist would, and returns conclusions. Each agent monitors its own domain overnight, Aria correlates their findings, ranks them and writes the brief, and every conclusion must cite its evidence and carry a confidence level. The cross-domain correlation, pairing a marketing symptom with a code change or a billing anomaly with a churn signal, is what lets the product point at a root cause rather than a chart. And because everything is read-only, the system's output is advice, so the user stays in control of every change. The stated outcomes are about time and money. Early users report that problems which used to go unnoticed for days are caught the same morning: one founder describes a Shopping campaign flagged at 6am for running against 47 zero-conversion search terms, with negatives added before lunch and $340 a day of spend recaptured. Another describes a Friday deploy that broke the GA4 purchase event and cost $2,200 over a weekend of blind paid ads, and says it will not happen again now that deploy-to-tracking breaks are caught the same day. A solo founder reports replacing 90 minutes across five dashboards with an eight-minute brief and one clear priority. The site also cites a 4.9 out of 5 rating from early users, a 24-hour path to a first finding, and a 100% read-only guarantee. The site groups findings by business type. For DTC and e-commerce businesses, Pitch flags wasted ad spend on specific keywords or search terms burning budget with zero conversions, and recommends negative keywords and bid changes. For SaaS and app businesses, Iris and Ada work together on conversion tracking blackouts, identifying the deploy that broke the tag and pointing at the line of code to restore. For local and service businesses, Echo catches local-search ranking collapses, surfacing which categories regressed and the on-page or schema fix likely behind it. For dropshippers, Echo and Ada catch a best-selling product page that disappeared from the sitemap or started returning a 404 after a deploy, within hours rather than weeks. For B2B and lead-gen teams, Iris, Ada and Sage cross-reference to catch lead forms that silently regressed after a deploy broke validation or the success event. For subscription businesses, Penny flags a surge in failed charges, the dunning gap behind it and the recoverable MRR before the churn compounds. DailyHelm is aimed at operators who run the whole business: DTC and Shopify founders, dropshippers, B2B SaaS operators, solo founders who want something like a part-time COO reading every dashboard, and, as a coming-soon capability, agencies that want to manage multiple client businesses from one panel with branded daily briefs they can forward to clients. It is also positioned for anyone short on time who would rather get a punch list than open eight dashboards. The product is offered with a 7-day free trial and no credit card, and setup is described as taking about five minutes. In short, DailyHelm turns the daily grind of checking analytics, ads, SEO and store tools into a single AI-written review that ranks the fixes most likely to protect or grow revenue. It combines domain-specific specialist agents, cross-agent correlation, evidence-backed recommendations and read-only access to the platforms a business already uses, so operators can stop guessing and start working on the thing that actually matters that morning.
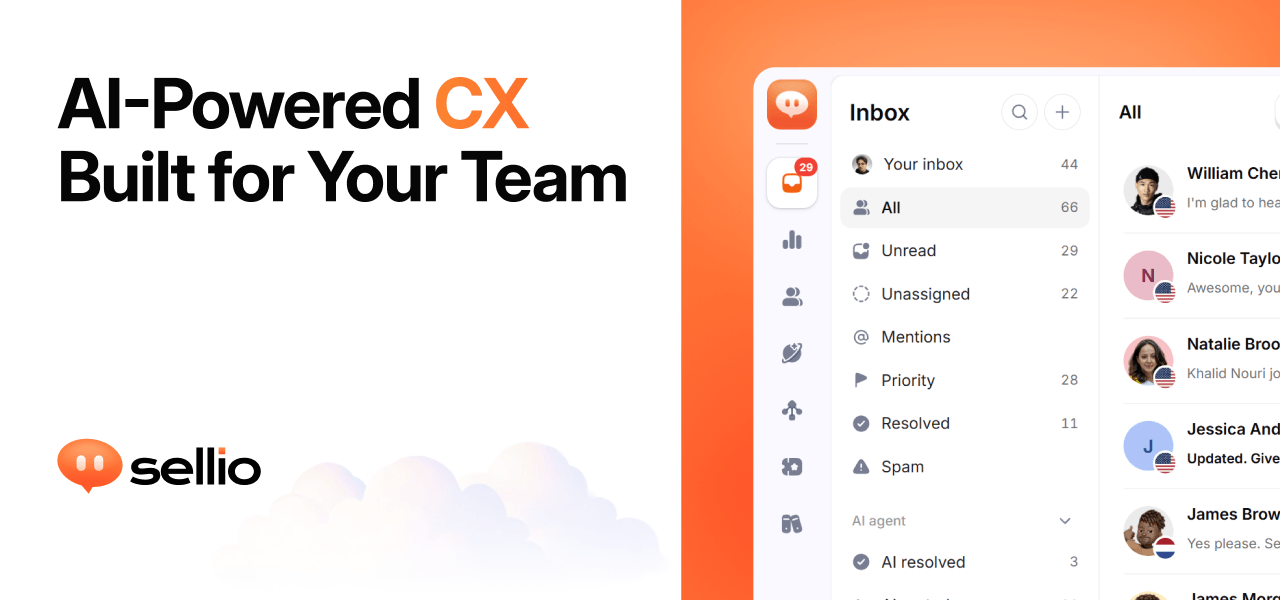
Sellio is an AI customer support platform built around one shared inbox. It collects website live chat, WhatsApp, Instagram, Telegram, and email conversations into a single place so a team can reply, take notes, and hand off work without losing context. Beyond the inbox, Sellio adds tickets, automations, an AI agent, and analytics. The AI agent is trained on your own knowledge — your site, docs, and FAQs — so its answers stay grounded in what you actually ship. Sellio is positioned for stores, hotels, SaaS teams, local businesses, help desks, and agencies: organizations that answer customer questions across several channels and want one shared inbox for every conversation, with AI added only when they are ready. The problem Sellio addresses is fragmented, easily missed customer conversations. Customer messages arrive on website chat, WhatsApp, Instagram, Telegram, and email, and when those conversations live in separate tools it becomes hard to keep track of the next step. Sellio's site puts it plainly: missed replies look the same in every industry. By keeping every reply, note, and handoff in one thread, the product aims to make the next step always clear, whether the conversation was raised by a live chat visitor, a WhatsApp message, or an email. It also raises work from a conversation as a ticket when a single reply is not enough, so nothing falls through the cracks as a thread turns into ongoing work. At the center of Sellio is the shared inbox. Every conversation lives in a clear thread that holds every reply, note, and handoff, so whoever picks it up next can see the full history and the clear next steps. The inbox is designed for teams: multiple people can work the same queue together rather than trading messages in private tools, and every channel lands in one place instead of being scattered across apps. When a conversation turns into work that continues beyond a single reply, Sellio raises a ticket from it, letting the team assign it and keep the full history attached. This means a support question can move from a live chat greeting to an assigned ticket without ever leaving the platform. The AI agent is optional and arrives when you decide you are ready. It is trained on your knowledge by pointing it at your site, docs, and FAQs, which keeps its answers grounded in what you actually ship rather than generic responses. It is designed to cover the first reply on website chat, so common questions get an immediate answer. When the AI cannot finish the job, it hands off to a person without losing context — the human agent inherits the same thread and history. Sellio also lets teams stay in control of cost, and the free plan includes one AI agent and five AI conversations to get started. Analytics are built to show what to fix next. Sellio follows every conversation to how it ended and how it felt, placing automation, resolution, and CX rates beside each other in one funnel. Topics are drawn from real chats, so teams can see what customers actually ask about, and response time is tracked so it can improve over time. CSAT is described as explaining itself, tying satisfaction back to the conversations that produced it. Automations are part of the same toolkit, sitting alongside the inbox, tickets, AI agent, and analytics in the product's main navigation, so routine steps can be handled while people focus on the conversations that need them. Getting started is deliberately simple. Sellio asks you to add one line to your site: a single script tag that installs an on-brand live chat widget, free to start. Website chat and the shared inbox are free, and the AI is used only when you want it. Email and messaging channels start on the Mini plan, and you pay only when you need more. Channels connect so that website chat, WhatsApp, Instagram, Telegram, and email all land in one inbox, and Slack, Discord, and Teams can mirror new conversations for your team. The overall approach is to centralize every conversation first, then layer AI on top of a knowledge base you control. For users, the outcome is one place to work rather than several. Teams see every reply, note, and handoff in a single thread, so the next step is always clear and colleagues can pick up work as a team. AI gives a first reply on website chat and hands off without losing context, so customers are not left waiting while staff stay in control of cost. Tickets keep ongoing work attached to the conversation that started it, and analytics turn real chats into topics, response times, and CX and CSAT measures that show what to fix next. Sellio describes itself as support that fits your industry, with concrete scenarios for each. For ecommerce, live chat on Shopify sits in the same inbox as WhatsApp, Instagram, and email. In hospitality, WhatsApp, Instagram, and website chat share one inbox for the front desk and operations. SaaS teams put website chat first and every other channel beside it in one shared inbox. Local businesses get a live chat bubble on their site plus the channels their neighborhood already uses. For help desks, work is raised from a conversation, assigned, and kept with its full history. Agencies get a shared inbox their team can assign, note, and resolve together, and any website can start with one script tag. Sellio is aimed at stores, hotels, SaaS, local teams, and agencies — anyone whose customers message on a mix of channels. Supported conversation channels are website chat, WhatsApp, Instagram, Telegram, and email, with Slack, Discord, and Teams able to mirror new conversations. The integrations page lists Stripe, ClickUp, Zoom, Salesforce, Discord, Telegram, Trello, GitLab, WhatsApp, Messenger, Jira, Linear, Shopify, Notion, Microsoft Teams, Zapier, Instagram, Asana, Slack, HubSpot, and GitHub, noting that six integrations are available now and the rest are on the way. Pricing starts free: website chat and the shared inbox cost nothing, with no trial clock and no credit card. The Free plan includes two seats, one channel, and one API key, plus one AI agent and five AI conversations. Nothing expires, and paid plans add more seats, channels, AI agents, and AI credits. Sellio's core value proposition is straightforward: one shared inbox for every conversation, the channels customers already use, and the numbers that show how every answer went. Start free with website chat and the shared inbox, then add AI when you are ready.
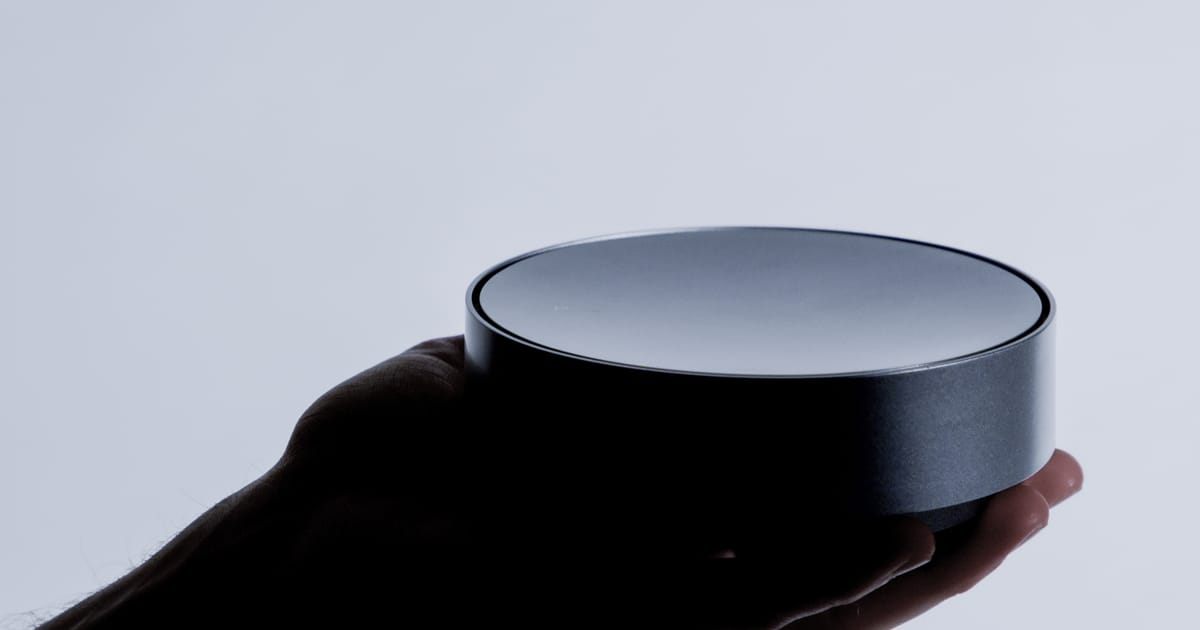
Phare C1 is an AI-powered smoke alarm from Phare Labs that detects fire and carbon monoxide early and accurately while cutting down on the false alarms that teach people to ignore their alarms. The company describes it as "the smoke alarm, minus the drama" and as "the upgrade your home has been waiting for," promising AI-powered early fire and CO detection backed by a peace and quiet guarantee. Phare C1 installs in place of your old smoke alarm — Phare calls it "plug and play peace of mind" and notes that being a smoke alarm is where the similarity with ordinary alarms ends. It pairs research-grade sensors with advanced AI and is, in Phare's words, meticulously engineered to protect the home that matters most: yours. Phare C1 is live in the UK, US pre-orders are now open, pricing starts from $149, and the product is a Red Dot Design Award Winner 2026. Phare frames the case for a new kind of alarm around three problems with the smoke alarms most homes already have. The first is false alarms: Phare states that up to 89% of the time a smoke alarm goes off, it is a false alarm. The second is missed fires: smoke alarms miss 28% of fatal fires, according to data from the NFPA. The third is the beeps themselves — Phare asks whether you actually know what they mean, adding that we do not speak morse code either. Together these failures produce alarms people stop trusting: one that cries wolf so often you silence it without thinking, yet can still fail to wake you when it counts. Phare's answer is a smoke alarm that detects fire, not toast — one that sounds for actual emergencies and nothing else, so that when it does go off you can be confident it is telling you something real. The core of Phare C1 is its multi-sensor array combined with Phare's AI algorithm. Phare says its AI algorithm detects more fires, earlier, and reduces false alarms, so that Phare alarms for fires and nothing else. The company states that Phare analyzes thousands of data points every minute to keep you safe, doing all of the worrying so that you do not have to. The alarm's detection algorithms learn and improve over time, which Phare says makes your home even safer the longer the device is installed. The practical result of this combination is early warning: the alarm responds sooner to real fires while rejecting the everyday cooking smoke and steam that trigger conventional units. Rather than being a single sensor with a fixed trip point, Phare is a system that evaluates what its sensors are seeing before it decides to sound. Phare C1 catches carbon monoxide sooner than other alarms. Phare measures CO with 0.1 ppm precision and sends exposure alerts before other alarms do, which means you can be told about a carbon monoxide problem while there is still time to act on it rather than only once levels have already climbed. Phare C1 and Phare C1 Pro also monitor air quality, which Phare says helps protect your health and longevity, turning the device into an ongoing indoor environment monitor as well as an emergency alarm. Alerts are delivered in the app — the product imagery shows a Phare Protect app carbon monoxide alert — so exposure warnings and other notifications reach you beyond the alarm itself. CO detection at fine precision and continuous air quality monitoring together make Phare a broader home safety and health device rather than a single-purpose siren. Phare C1 and Phare C1 Pro sense motion in the dark and softly light your path, so you are not fumbling for switches during a night-time trip down the hallway. Phare describes this as lighting the way at night, and customer reviews specifically call out the pathlights as something they value. When something happens, Phare tells you what is going on and what you can do about it instead of leaving you with mystery beeps, so you can respond before it gets loud and react before an alarm sounds to keep your home safe and quiet. The alarm tests itself and never needs batteries — Phare's instruction is simply to set it up and let the device do the rest. Phare C1 Pro adds intruder detection: its radar array spots intruders and sounds the alarm to drive them away. The Product Hunt listing notes that Phare C1 keeps much-loved features from the Nest Protect, such as early warnings, a night light and in-app alerts, and adds new ones including air quality monitoring and intruder detection. Phare's overall approach is to combine a multi-sensor array, research-grade sensors and advanced AI inside a device that replaces the smoke alarm already on your ceiling. Because Phare installs in place of your old smoke alarm, upgrading does not require rewiring your home or learning a new routine. Once installed, Phare continuously analyzes the data its sensors collect — thousands of data points every minute — and uses its detection algorithms to decide whether what it is sensing is a genuine emergency. That is what allows it to respond sooner to real fires while ignoring the toast. The Phare app, available at app.pharelabs.com, is where you log in to see what is happening, receive alerts such as early CO exposure warnings, and get Phare's guidance on what to do. Phare Labs also publishes API documentation, indicating the platform can be accessed programmatically, and states that Phare's detection algorithms learn and improve over time. The promised outcome is peace of mind backed by explicit assurances. Phare offers a Peace & Quiet Guarantee: no false alarms in the first 30 nights, or Phare will refund you in full. Free returns are available with no charge and no hassle from anywhere in the US and UK. An extended warranty provides up to 5 years of coverage with Phare+ Pro. Beyond the guarantees, the benefit Phare describes is a home that is protected earlier — fires and carbon monoxide caught sooner, an alarm that sounds only when it matters, guidance instead of confusion, and quieter nights thanks to pathlight. Customer reviews on Trustpilot echo these themes: users describe a straightforward installation, outstanding technical support for pre-sales and installation, a problem-free basic alarm function, great pathlights, and units that produce lots of useful home data. Concrete scenarios in the content include replacing an expiring alarm: one reviewer describes a successful transition from expired, mains-powered Nest Protect devices to three Phare C1 units, and others describe Phare as an amazing Nest replacement that provides far more detail than the Nest ever did. Another everyday scenario is the kitchen — the product is pitched as a smoke alarm that detects fire rather than toast, so cooking no longer routinely triggers the siren. At night, Phare C1 and C1 Pro sense motion in the dark and light a hallway path. For carbon monoxide, Phare sends exposure alerts with 0.1 ppm precision before other alarms do. Air quality monitoring supports ongoing awareness of the home environment, and Phare C1 Pro's radar array detects intruders and sounds the alarm to drive them away. More generally, Phare lets users respond before it gets loud — reacting before an alarm so the home stays safe and quiet. Phare C1 is aimed at homeowners who want earlier, more accurate fire and CO protection without false alarms — in particular people replacing older smoke alarms or expiring Nest Protect units, and households that want air quality monitoring and night-time pathlighting. Phare C1 is live in the UK and US pre-orders are now open, with pricing starting from $149. Phare currently offers $35 off any order of 2 Phares or more for people who leave an email, with the code PHARE25 shown at checkout. The site supports USD and GBP currencies, there is a shop with a comparison tool to find your Phare, and a cart flow for pre-orders. US orders ship once UL certification is complete, estimated summer 2027, and pre-orders can be cancelled anytime for a full refund. Support is available through the contact page, along with FAQ, legal, accessibility, privacy and API documentation pages. Phare C1's primary value proposition is simple: a smoke alarm that sounds for real emergencies and nothing else. By pairing a multi-sensor array and research-grade sensors with AI algorithms that detect more fires earlier, reduce false alarms and improve over time, Phare aims to restore trust in the alarm on your ceiling. Add early carbon monoxide detection with 0.1 ppm precision, air quality monitoring, pathlight, self-testing with no batteries, in-app guidance and — on Phare C1 Pro — radar-based intruder detection, and the C1 becomes more than a replacement alarm. Backed by a 30-night Peace & Quiet Guarantee, free returns in the US and UK and up to 5 years of warranty coverage with Phare+ Pro, Phare C1 is positioned as the upgrade your home has been waiting for: protection that works earlier, and a quieter home.
Polylane is a platform that makes your software self-operating. Its AI agents read your code, watch your infrastructure, and fix production issues for you, automatically. Polylane connects your code, your infrastructure and your observability data, investigates every incident it detects, and opens a pull request containing the fix. When a problem cannot be fixed in code, Polylane still gives you the root cause and a recommendation. It is built for engineering teams that run production software and want to stop being on call, and it works with the providers, databases, repositories and tools a team already runs, with no migration and no new SDKs. The premise behind the product is stated plainly on the site: "Nobody should be on-call." Polylane was built by engineers who carried the pager, from Cloudflare, Webflow, Groq, Twilio, Uber, and Robinhood. Founder Boris Tane, who spent years building observability platforms at Baselime and then at Cloudflare, describes the gap directly: "Our tooling is still terrible at finding what's broken, and it can't fix anything on its own. On-call is still broken. I'm fixing it." The problem Polylane addresses is that observability stacks surface symptoms — monitors, dashboards and alerts — but leave the investigation, the diagnosis and the repair to a human who has to be awake to do it. Polylane is designed to close that loop: detect the issue, work out what caused it, and produce the fix. Detection is handled by agents that read your metrics, logs and traces on a cadence and judge them against how each resource normally behaves. Anything your team already charts becomes a check, so existing monitoring investments feed directly into Polylane's analysis. The site illustrates this with a real scenario: Polylane re-detected an issue on checkout-edge when the same fingerprint fired again, quiet for six days since its last resolution, and recorded 118 occurrences arriving from a single Datadog monitor. Rather than treating 118 alert firings as 118 separate problems, Polylane consolidated them into one issue, which is how it keeps incident noise from turning into pages. From there, Polylane drives from issue to fix. It triaged the checkout-edge problem as an incident at 02:14, noting 18x P99 latency against its own baseline, sustained for 12 minutes and off its hour-of-week band. It then started the fix run: one agent going from the evidence to the pull request, which it opened at 02:19 under the title "Restore Hyperdrive pool size in checkout-edge," against coreplane/checkout-edge#142 with critical severity and CI passing. The pull request carries the full context of the investigation — files changed, an investigation view, a timeline, properties, and a unified or side-by-side diff of the TypeScript source — so a reviewer sees the reasoning, not just the patch. That example directly reflects the product's promise: AI agents that fix production before you wake up. Polylane also prevents slop from hitting production. All code changes, from bots and engineers alike, get reviewed against live telemetry. In the example shown on the site, a developer opens a pull request titled "Add trigram index for order search #482." The Polylane bot comments with a caution that merging may degrade production with high impact, explaining that the migration adds a CREATE INDEX statement without CONCURRENTLY, that a plain CREATE INDEX takes a full write lock on the orders table for the whole build, and that checkout sustains roughly 38 writes per second on that table, with every one of those writes queuing behind the lock. It recommends building the index with CREATE INDEX CONCURRENTLY outside the transactional migration, and the merge is blocked. This is production-impact review grounded in real traffic data rather than static analysis alone. Underneath these workflows is a context graph that fully maps your app, from cloud to code: all services, repos and providers in one place that powers everything else. The topology view lets you search your cloud resources and filter them, switch between Galaxy, Flow and Table presentations, and see issue hotspots and change hotspots per resource. Clicking a dot opens the resource, and holding traces its blast radius. Resources are annotated with their importance — a Cloudflare Worker named checkout-edge marked critical to your architecture, with four issues and twelve changes in the last seven days; a Cloudflare Hyperdrive instance with seven changes in the last seven days; an AWS Lambda function marked standard with two issues; and a PlanetScale database marked critical with one issue and three changes — and you can ask questions about your topology in natural language. Polylane is also always available to answer questions on call. It knows your app and will dig through data for you. In the Slack example shown, an engineer asks in the engineering channel whether checkout feeling slow is them or payments-api. PolylaneAgent answers that it is them, that checkout-edge wall time P99 is 18x its own baseline, that requests are queuing for a Hyperdrive connection rather than on a downstream call, that payments-api is answering in 180ms and has been flat for a week, and that deploy 9f3c2a1 at 2:02 AM shrank the hd-prod pool from 50 connections to 5. Asked how long it has been queueing, it answers nine minutes, since the deploy landed, notes it never went above 2 before that, and reports that it submitted a PR fix and tagged a colleague to deploy two minutes ago, with a pool queue depth chart attached. It shares insights with other agents as well, acting as a production context layer for your coding agents over MCP or the CLI. In the example, a developer asks Claude to make region a required field on the checkout request schema. The coding agent calls Polylane to search callers of POST /checkout and to query logs for request shapes, then reports that cart-svc and edge-gateway still send region-less requests — 41,200 in the last 24 hours — so requiring the field now would return 400s to both, and suggests defaulting it, migrating the two callers, then requiring it. The developer is offered a choice of plans rather than an unreviewed edit. Control stays with the team. Polylane does not change production without review: every write pauses for your approval with the exact request on screen, and code changes arrive as pull requests that your review and your CI gate. That combination — autonomous investigation and fix generation, with human approval and existing CI as the gate — is how the product keeps automation accountable in environments where a wrong change is expensive. Polylane integrates with AWS, Cloudflare, Vercel, Fly.io, Render, Kubernetes, PlanetScale, Railway, Supabase, Modal, Convex, ClickHouse and Turso, plus GitHub, Slack, Linear, Cursor, Devin, Factory, Conductor and MCP. On the observability side it works with Datadog, Honeycomb, Axiom, Grafana Cloud, Sentry, Better Stack, OpenStatus and Logfire. It also offers a REST API at api.polylane.com and an MCP server at mcp.polylane.com/mcp, and the site is machine-readable at polylane.com/llms.txt, so AI agents can use it too. Security is presented as non-negotiable: SOC 2 Type II, ISO 27001:2022, AES-256 encryption at rest, TLS 1.2+ in transit, and fully isolated data per organization. You can get started for free from the Polylane console, or install the CLI with a single command on macOS or Linux. In short, Polylane's value proposition is that your software operates itself: issues are found from the telemetry you already collect, incidents are investigated end to end, fixes arrive as reviewable pull requests, risky changes are flagged against live traffic before they merge, and the questions of on-call are answered in the tools your team already uses.
NotchDodo is a macOS app that turns the notch at the top of a MacBook display into a Dynamic Island-style panel, giving Mac users quick access to a set of everyday utilities without interrupting their work. Hovering above the menu bar opens a dark dashboard that holds music controls, timers, today's calendar, files, notes and AI agent usage in one place. It is built specifically for Macs with a notch, and it also runs on Macs without one by drawing a simulated island at the top centre of the screen. The app is a one-time purchase aimed at anyone who wants the notch to become a useful part of their daily workflow rather than dead space. On modern MacBooks the notch is a piece of hardware that most software simply works around. Menu bar icons slide behind it and vanish when a lot of apps are running, and everyday information such as the current track, a running timer or the next meeting tends to be scattered across separate apps and separate windows. NotchDodo takes the opposite approach: instead of ignoring the notch, it treats it as a surface that can show what matters right now. The result is that the user does not have to switch apps, hunt through invites or dig through logs to know the shape of their day or what their coding agents are doing. The Dashboard is the home page of the notch. It shows eight tiles on a dark panel separated by hairlines, and the user chooses which eight appear and in what order by clicking the gear. Today, Tasks, Notes and Reminders appear in miniature, each one tap away from its full tool. A Launcher shows the apps in the Dock five at a time, Day Progress tracks the workday set in Settings and rotates a short focus tip, and quick toggles cover Dark mode, Keep awake, Screenshot, Lock screen and Empty Trash. Music, AI Usage, System, Shelf and Screen Time tiles can be swapped in and reordered. Pomodoro is a watch-style dial with tick marks and a gold hand; starting a session moves the countdown into the notch so it stays visible while the user works in any app. Five modes cover the day — Work, Short break, Long break, Quick timer and Custom — and focus sounds play rain, café chatter or white noise with each focus block, fading out when the break begins. Every fourth completed session earns a long break, Focus Target attaches a session to an event, reminder or task, and a stopwatch with laps covers everything that is not a Pomodoro. AI Usage reads the session logs that Claude Code, Codex and Gemini CLI already keep on the Mac and turns them into a live picture: tokens today, estimated cost at API list prices, and the five-hour window with its budget bar, burn rate and reset time. Each session shows its state — Running, Waiting or Done — along with the model, the git branch and the last prompt typed. Model tags cover Fable, Opus, Sonnet, Haiku and Gemini, with a CLI tag and a seven-day chart, and while an agent runs the notch shows a purple burn bar and token count and flashes when the window crosses 80 and 100 percent. The budget is learned from the largest past window or set manually in Settings. Dev Servers lists every local server that is running, with its port, the project folder it was started in and the framework such as Next.js, Vite, Django, Rails or Postgres, so a server can be opened in the browser or stopped with a click, ending the "port 3000 is already in use" problem. Menu Bar lists every menu bar icon, marks the ones the notch is covering and opens any of them with a click, using the system's own reveal button on macOS 27. Today shows every event for the day in a list with a details pane giving duration, location, notes and a countdown to the next start, and Zoom, Meet, Teams, Webex and FaceTime links become a single Join button. Ten minutes before a call the notch shows a countdown without being opened; five minutes before, it opens on the meeting with the Join button and then tucks away. Events come from every calendar enabled on the Mac. Reminders reads real Apple reminder lists through EventKit and syncs back through iCloud, showing counts for overdue, due today and later, with quick add by typing and pressing Return and one-click completion reflected everywhere. Tasks is a to-do list with no setup for the small things that do not deserve a project — the list is kept on the Mac and nowhere else, with an open count, a progress bar for the day and a history of done items. Notes saves as you type, using the first line as the title, storing notes as plain files in the Application Support folder and showing word and character counts plus the time of the last save. Music provides Now Playing controls for Apple Music and the Spotify desktop app, with artwork, a scrub bar and transport controls; while something plays, the notch shows the art and four moving bars. Shelf is a holding area for files: drag them onto the notch from Finder and they wait until needed, then drag them back out into Mail or Slack, AirDrop the lot or reveal them in Finder. Downloads and screenshots land there too, and hovering an image and tapping the wand converts it to PNG or JPG, halves it, shrinks it to 1920 px or compresses it. Calculator handles maths with proper precedence, percentages the way people say them and conversions for units and currencies, updating the result as you type and keeping a history with Return. Screen Time counts active time per app only while the user is actually at the keyboard, leaving out idle time, the lock screen and sleep, and groups apps into categories such as Development, Browsing and Communication with a donut and a bar, a Now card, a daily ranking and insights for the average and longest stretch in one app; every Monday and on the 1st a shareable Wrapped recaps focus time, Pomodoros, cursor distance, meetings, the top app and AI usage. System Analytics shows CPU, memory, storage, network, battery and free disk as tick gauges in the style of a watch face, sampling only while the tab is open. Mirror gives a 4:3 mirrored preview from the built-in camera before a call, starting when the tab opens and stopping when the notch closes. Dodo Run is an endless runner inside the notch, built for the minutes Claude Code is busy; it pauses and shows the alert the moment Claude needs approval, is waiting for a prompt or finishes. Support & Feedback lets users send help requests, reviews, general feedback, feature requests or bug reports from the panel, opening an email with the macOS and app version already filled in. NotchDodo is designed the way the Dynamic Island was built. The notch band and the compact pill never change colour, so they merge with the camera housing, while the panel below is a solid dark dashboard with hairline dividers that reads on any wallpaper. Every size change uses springs rather than slides, overshooting a touch and settling, with digits that roll like a clock and nothing fading in for decoration. Seventeen tools ship in the box, each one a keyboard shortcut away if wanted; turn off ten and the rail shows seven. Permissions are asked for when a tab is opened, never at launch, and the notch stays black and silent until something is worth a glance, then grows a little and shrinks back when the user is done. It handles many things automatically: it shows album art while music plays, a running countdown and ring while focusing, a four-second notice when charging and a warning below twenty percent, a countdown ten minutes before a meeting, tokens over a purple burn bar while an agent works, download progress, a pulsing Claude mark when Claude needs approval, a chime and tick when a timer finishes, and a one-time notice when an update is ready. The benefits follow from that design. Information that would otherwise require switching apps or hunting through windows is one hover above the menu bar, so the user keeps working while staying aware of the next meeting, the running timer, the current track, the files waiting to be dealt with and how much of the AI usage window has been consumed. Because everything is read locally, nothing about the user's tasks, notes, Shelf, screen time, AI usage or Wrapped leaves the Mac; the app only goes online to check the licence when activated and about once a week, to check for updates, once if a trial key is activated, for exchange rates if currencies are converted in the calculator, and for Spotify album art while Spotify plays. The focus sounds are made on the Mac, so nothing downloads and they never loop. The app also avoids getting in the way: while another app is using the camera, hovering the notch will not open it and timers will not pop it open over a call, and NotchDodo can be hidden in full-screen apps in Settings. Concrete situations shape the way NotchDodo is used. While a coding agent runs, the user glances at the notch to watch tokens tick up over the burn bar, plays Dodo Run during the wait and sees the Claude mark pulse when approval is needed, then returns to work. Before a call, a countdown appears ten minutes ahead and the notch opens on the meeting with a Join button five minutes before, so no invite has to be searched. During a focus block, a Pomodoro session keeps its countdown in view with rain, café chatter or white noise playing, and a long break is queued automatically after every fourth session. When a file downloads in Safari, Chrome, Edge, Brave or Firefox, its progress shows in the notch and the finished file appears on the Shelf, ready to drag into Slack, while new screenshots wait there too. When local development gets tangled, Dev Servers shows which localhost servers are running and lets the user open or stop one with a click without breaking a coding agent's private helpers. At the end of a week, Screen Time's Wrapped recaps where the time went. NotchDodo is made for Mac users on macOS 14 Sonoma or later on Apple silicon, and Macs without a notch get a simulated island so everything behaves the same. It is a direct download from notchdodo.com rather than an App Store app, so a new version is announced in the notch and downloaded with one click, with no waiting on store review. Pricing is a one-time purchase: $4.99 as a launch price for the first 50 customers, then $14.99, with no subscription and no account. A licence key arrives by email and unlocks the download on 2 Macs, with lifetime updates included, a 14-day refund on request by email, and a private-by-design approach in which nothing leaves the Mac except the licence check. It integrates with Apple calendars, Apple Reminders through EventKit and iCloud, Apple Music, the Spotify desktop app, Claude Code, the Codex CLI and Gemini CLI, and asks for Accessibility access for the Menu Bar tool and camera access for Mirror. NotchDodo turns a piece of Mac hardware that most software works around into a compact dashboard for the day. Seventeen tools, one hover above the menu bar and a one-time price make it a way to keep music, timers, meetings, files, notes and AI agent usage in view without leaving the work in front of you — a more useful Mac, with the notch doing the talking.
Would you pay? is a web product where indie makers show their startup to real people who swipe right if they would pay for it and left if they would not. Makers use it to see real demand instead of likes, and to find out who would pay before they build more. The deck currently holds 102 indie startups and the site reports 6,499 swipes so far. Anyone can start swiping without an account, and makers can add their own startup for free so their card goes into the deck right away. The result makers get is a percentage — the share of people who would pay — plus a view of who those people are and how many of them clicked through to the startup's site. The problem it addresses is that most side projects fail quietly: months of building, then nobody pays. A like, a supportive comment or a spike of attention does not tell a maker whether anyone will actually open their wallet, and those signals often arrive after the work is already done. Would you pay? moves that question to the front of the process. It shows a startup to people browsing a deck of indie projects and asks them one blunt question through a single swipe: would you pay for this? Because the left swipe is as easy to give as the right one, the answer the maker receives is described as real demand rather than applause. Swiping is deliberately simple. Each card in the deck presents an indie startup, and a swiper drags right if they would pay for it and left if they would not. The site describes a right swipe as meaning that the person would pay for the product based on their first impression. It is explicitly not a purchase and nothing is charged — the swipe only tells the maker whether their pitch works. Makers see who would actually pay, which turns the deck into a lightweight demand test rather than a popularity contest. There is no signup required to swipe: the site promises that opening the deck brings up the first card in about a second. For makers, the results view is the core of the product. It reports the share of people who would pay, whether those swipers are developers, founders or marketers, and how many of them clicked through to the startup's site. The percentage only appears after 10 swipes, a rule the site explains as protection against one or two early votes skewing the number. The full breakdown is private to the maker who owns the card, but a public share page for each startup shows the headline percentage once the card passes 10 swipes, so the result is ready to be posted on X. That split matters: the maker keeps the detailed audience and click-through data, while the headline number can be shared publicly as social proof. Makers log in with a one-time email link and no password, which keeps the results view lightweight. Adding a startup costs nothing, and the site states that the card goes into the deck right away. A startup that has been added is then swiped by people who are already browsing, so the maker does not have to recruit an audience of their own to get an answer. Because the same deck mixes indie projects, every swiper sees a stream of products and makes a series of quick willingness-to-pay judgements on the cards that come up. Boost is the optional paid layer. For $19, a card is placed at the front of the deck for 24 hours so that nearly every new swiper sees it first. Up to five cards can be boosted at the same time, and they share the front of the deck in random order rather than a fixed sequence. Boost also carries a guarantee: if the card does not reach 100 swipes within 24 hours, the site keeps boosting it for free until it does. The site is explicit that swipes stay honest under Boost — people still swipe right only if they would pay — so the paid option is positioned as a way to get answers faster rather than a way to buy yes votes. The product's approach rests on a specific claim about what a swipe is worth. The site describes "I'd pay" as intent, not a sale, but argues it is a harder yes than a like, because first impressions decide whether someone clicks through at all. That framing shapes everything else: the swipe is a single, cheap judgement made on a first impression, the percentage is withheld until enough swipes accumulate to be meaningful, and the click-through count adds a second tier of signal for makers who want to know whether the card did more than earn a nod. The outcome for makers is a faster read on whether their pitch lands and who it lands with. Instead of guessing after months of building, a maker gets a percentage of people who would pay, a breakdown of the kinds of people those are, and a count of how many went as far as clicking through to the site. The public share page turns that number into something the maker can post, and the private breakdown shows whether the audience leaning in is made up of developers, founders or marketers. For swipers, the experience is a browsing activity — looking through indie startups and, in one gesture, telling the maker whether the product is worth paying for. Typical use cases follow directly from the deck. A maker with a finished or half-finished side project can add it free and let the deck tell them whether anyone would pay before committing more build time. A maker who needs an answer quickly can pay for Boost, which puts the card at the front for 24 hours and guarantees it reaches 100 swipes or keeps boosting for free. A founder preparing a launch can use the public share page, which reveals the headline percentage after 10 swipes, as material to post on X. And a maker comparing pitches can look at what share of developers, founders or marketers would pay and how many clicked through to the site, using those details to judge which audience the product speaks to. The primary audience is indie makers and founders of side projects — people who build small products and need to know whether there is paying demand before they invest more. The swiping side of the deck is open to anyone with a browser, since no account is needed to start. The product runs on the web, positioning itself around marketing and startup validation rather than around analytics dashboards. Pricing is straightforward: swiping is free, adding a startup and seeing your results is free, and the only paid option is the $19 Boost. Would you pay? reduces a hard question — will anyone pay for this? — to a single swipe and a percentage. By collecting right swipes only when a person would genuinely pay, by hiding the number until 10 swipes are in, and by keeping the detailed audience and click-through breakdown private while publishing a headline figure for sharing, it gives indie makers a real demand signal, not a pile of likes.