Category Focus/categories/developer-tools
Developer Tools AI Tools
Discover and compare the best developer tools AI tools and software. Browse 571+ curated tools with reviews and rankings.
Projects tracked
571
Sort mode
RECENT
Page
2
Discover and compare the best developer tools AI tools and software. Browse 571+ curated tools with reviews and rankings.
Projects tracked
571
Sort mode
RECENT
Page
2
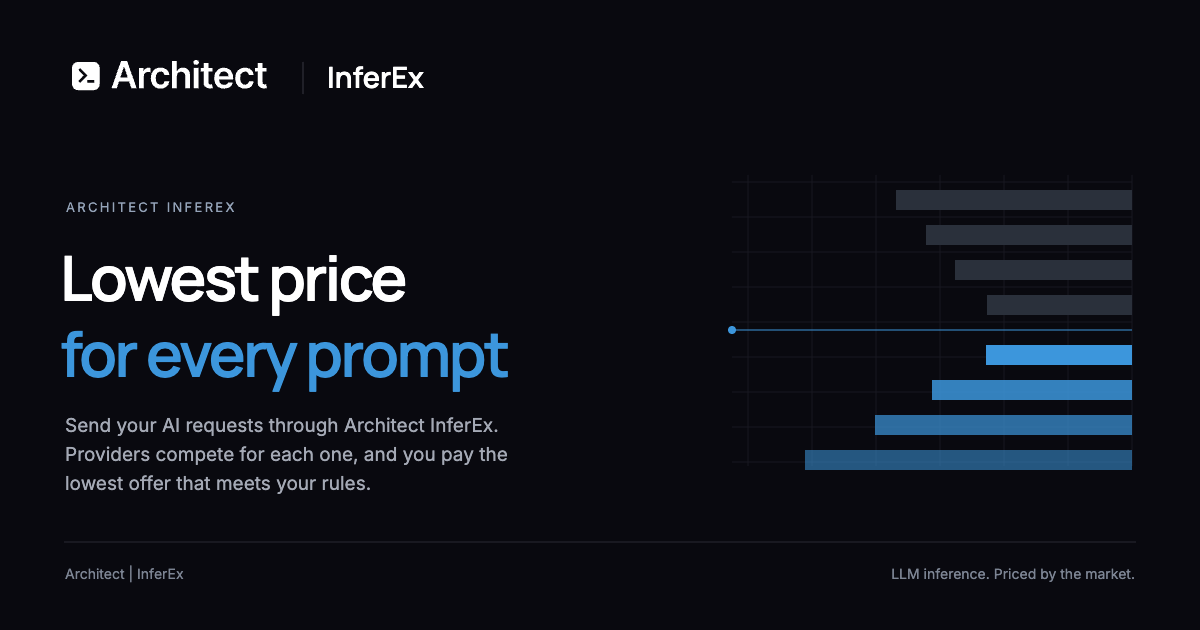
Liquid Inference is an LLM router built around a single promise: the lowest price for every prompt. You send an ordinary chat request and providers compete to answer it, so your request is completed at the lowest price that still satisfies the requirements you set. It is aimed at developers, engineers and teams who reach large language models through an API, from someone wiring up a single coding agent to organisations pushing large volumes of inference, and its purpose is to turn model access into a competitive market rather than a fixed rate card. Signing up is free with an email address, and you receive an API key to use with one base URL. The problem it addresses is that inference is normally bought at list price. Conventional access means choosing a vendor and accepting whatever rate card that vendor publishes, even though the underlying capacity is supplied by many providers whose costs and spare capacity change constantly. Providers drop their prices when they have spare capacity, but under a published rate card that movement never reaches the buyer. Liquid Inference moves that dynamic into the request path. Instead of negotiating contracts, you let providers bid for each individual prompt and you pay only for the tokens the model produces. Because routing rules constrain model, region, speed and minimum quality, the competition happens strictly inside boundaries you define. The mechanism is an instant auction for every request, described on the site in three steps. First, providers set their prices: each provider sets a price per token for each model and can change it at any time. Second, the cheapest match answers: you set the rules, covering model, region, speed and minimum quality, and the cheapest provider that meets them answers your request. Third, you pay for what you use: before the model starts you know the most a request can cost, and you are billed only for the tokens it produces, with the cap fixed before the first token. The practical effect is that cost exposure is known in advance instead of being discovered on an invoice later. Routing is yours to control. You choose the model, region, speed and minimum quality, and only providers that meet those requirements compete, which means the auction can never push a request outside your constraints. The site also supports routing rule presets and Auto routing algorithms for teams that would rather not define every rule by hand. Alongside routing sits a price limit on every request: the maximum a request can cost is fixed before the model starts. Together, the two controls make cheapness one dimension of the decision rather than the only one, since quality, geography and latency stay in your hands. The catalogue is broad. Liquid Inference covers hundreds of open- and closed-weight models with full multi-modal support. The site lists model families with their counts and lowest current offers, including GPT with 55 models, Qwen with 53, Gemini with 46, GLM with 31, Deepseek with 28, Gemma with 25, Kimi with 18, Grok with 16, Claude with 16, Mistral with 14, O with 9 and Nemotron with 8, alongside Ernie, Mimo, Llama, Muse, Seed, Doubao, Minimax, Aion, Phi, Nova, Command, Mercury, Hermes, Longcat, Ling, Ministral, Step, Hunyuan, Claw, Fugu, Nex, Reka, Granite, Synth, Laguna, Agnes, Schematron, Solar, Unslopnemo, Remm, Weaver, Sonar, Morph, Inkling and Relace. A live offer board shows the cheapest offers on the book, headed in the example shown by Nemotron: Nano 9B V2 at 0.01 and DeepSeek V3.1 at 0.02 USD per million output tokens. Compatibility is deliberately conservative: one key covers OpenAI and Anthropic APIs. OpenAI Chat Completions and Anthropic Messages are served on one base URL, so your existing code works unchanged. In practice you change the base URL in any client that speaks either API and keep everything else the same; the documented edit is a single line pointing base_url at the router with your Liquid API key. That means the router can be adopted without a rewrite, and the same key serves both API dialects. Because the interface is standard, the product plugs into the AI coding tools teams already use. The site lists Claude Code, Codex, Pi, Oh My Pi, Cursor, OpenCode, Cline, Roo Code, Kilo Code, Goose, Open WebUI, Cherry Studio and n8n as supported clients, together with the OpenAI SDK, Anthropic SDK, Claude Agent SDK, OpenAI Agents SDK, Vercel AI SDK, LiteLLM, LangChain and curl. Fully compatible with agentic coding tools and full multi-modal support are both stated up front, so an agent that already speaks the OpenAI or Anthropic API can be pointed at the router without changes to its internal logic. Transparency sits alongside the pricing model. Billing is itemized, so you can see what every request cost, line by line, and reconcile spend per request rather than per invoice. Under market data, Liquid Inference publishes a public price history: you can download live and past prices for every model and send work when prices are low. On the provider-trust side, an architect tests every provider regularly with standard benchmarks and publishes the results. Customers see a provider's price, speed and measured quality, and the same rules apply to every provider. The platform is two-sided. If you already run models, you can sell inference on them: your software posts a price and changes it whenever your costs do, and when you win a request you are paid for the tokens you serve. Providers set their own price with no fixed rate card, can change it as often as they like, control load by stopping quotes when full, and lower price when they have spare capacity. Winning is on price and quality, since customers see price, speed and measured quality under the same rules. Records are clear, with every job and payment checkable against the provider's own logs. Registration takes four steps: create an account, register the deployment you want to serve, an operator reviews it and lists it, and your agent connects and starts quoting. Registration is free, and Liquid Inference charges its fee to the customer rather than to the provider. For the buyer, the outcome is straightforward: competitive lowest marginal cost on each prompt, a hard price ceiling known before the first token, and the freedom to set constraints on model, region, speed and quality. You get one key and one base URL across OpenAI and Anthropic APIs, itemized records of what each request cost, and public price history that lets you schedule flexible work for the moments when providers are cheapest. Free signup with an email address lowers the barrier to testing, and the first 500 users receive $20 of free inference. The use cases follow directly from those mechanics. Agentic coding tools such as Claude Code, Codex, Cursor, Cline and OpenCode can be repointed at the router so each prompt is served by the cheapest provider that meets your rules, with multi-modal requests handled by the same key. Teams planning a budget can pick a model and a monthly output volume of 1M, 10M, 100M or 1B tokens and read the estimated cost per month from the lowest offer on the book, remembering that input tokens are priced separately. Cost-sensitive batch work can be timed against the public price history. Workloads with regional, latency or quality requirements can specify them and let the market satisfy them. Pricing is usage-based: you are billed per token produced, with input tokens priced separately, and there is no rate card to accept. Signing up is free with email, and the first 500 users get $20 of free inference; referrals earn 20 percent of referred fees as free inference and 10 percent for second-level referrals. On the supply side, registration is free for providers and the platform's fee is charged to the customer. The product is delivered as a web sign-up and API service reached through a single base URL, https://router.inference.ai.exchange/v1, with integrations spanning coding agents, chat UIs, automation tools, SDKs and frameworks. In summary, Liquid Inference turns AI inference into an auction. Providers post and revise prices per token, your routing rules decide who is eligible, the cheapest eligible provider answers each prompt, and a fixed cap tells you the most a request can cost before the model starts. You pay only for the tokens produced, see the cost of every request line by line, and can join the market from the other side to sell capacity on the models you already run. The value proposition is the one in the title: the lowest price for every prompt.
Markdoc is a shared editor for Markdown that places a code editor and a rich preview side by side inside a single document. You can type in either surface and the other follows instantly, cursors included, live for everyone in the document. Its purpose is to make Markdown a genuinely collaborative format, where writing, reviewing and publishing all happen in the same place. It is built for people who already work in Markdown and want the presence, comments and version history they expect from modern document tools — writers, developers and teams whose files live in GitHub. Markdown is one of the most durable writing formats there is: plain text, easy to diff, easy to store in Git. Its tooling, however, has traditionally been solitary. Collaborative work in Markdown usually means copying text out into another tool for review, leaving feedback in a separate chat thread or issue, and losing any clean record of who changed what and when. Markdoc addresses that gap by treating a Markdown file as a live, shared document rather than a static blob of text. Collaboration happens on the document itself, comments stay attached to the words they were written about, and versions are captured automatically, so the file remains the single source of truth from first draft through to publication. The core of the product is its two-surface editing model. A code editor and a rich preview sit side by side, and typing in either one updates the other instantly, cursors included. That means a writer can work in the rendered view while a developer works in the source, and both see the same document change in front of them in real time. Real-time collaboration runs across both surfaces, with presence indicators, live carets and selections, and conflict-free merging, so simultaneous edits do not overwrite one another. The editor also works offline and catches up when you reconnect, which keeps writing uninterrupted on an unreliable connection, a plane, or anywhere the network drops out mid-sentence. Review is handled by two complementary features. Comments anchor to specific text and follow those words as the document changes, so a thread stays where it was written even after paragraphs move or text is rewritten; threads can be replied to, resolved and reopened. Suggesting mode turns edits into tracked changes rather than direct modifications: a contributor proposes an edit, and the document owner accepts or rejects each suggestion individually or all at once. Together these give a Markdown file the same review mechanics as a collaborative word processor, without giving up the plain-text format underneath — the source is still the source, it simply now carries a conversation and a decision trail with it. Version history and GitHub-native storage close the loop. Markdoc takes automatic snapshots while you work and lets you name versions when it matters, with word-level diffs and one-click restore, so a bad edit is always recoverable and a good state can be pinned deliberately. Storage is GitHub-native: you can open any Markdown file from a gist or a repository, and publishing creates a real commit on the branch you choose. Markdoc also supports bringing your own agent over MCP, so an AI agent can take part in the same document as a collaborator, and you can publish straight to a gist or a repository file once the work is ready. How the product works overall is defined by keeping everyone on the same document. Both surfaces are backed by the same content, and edits from either side are merged conflict-free, including edits made while offline. Because the underlying file lives in GitHub, publishing is not an export step but a commit: the document you have been editing becomes a change on a branch. That single-threaded approach — one document, two views, one storage backend — removes the copy-paste-and-reconcile cycle that normally sits between writing Markdown and getting it into a repository. The benefits follow directly from that design. Teams stop losing review context because comments travel with the text they annotate, and they stop overwriting each other because merging is conflict-free across both surfaces. Suggestion mode lets an owner keep control of a document without rejecting help outright, since every proposed change can be judged one at a time. Word-level diffs and named versions make it safe to edit freely, knowing any state can be restored in one click. And because publishing is a real commit to a branch, the path from draft to repository is short — no manual formatting pass, no export-and-paste step, and no divergence between what was reviewed and what was shipped. Concrete use cases follow the way Markdown is already used. A team maintaining a README or project documentation can open the file from the repository, discuss changes in anchored comment threads, and accept suggested edits before publishing a commit to the chosen branch. A technical writer and an engineer can co-edit a specification, one working in the source and the other in the preview, seeing each other's cursors as the document evolves. A blogger or newsletter author can draft in Markdown, review with a colleague using comments and tracked suggestions, keep a named version at each milestone, and publish to a gist. Anyone working with an AI agent over MCP can have the agent draft or revise content inside the same document that humans are reviewing, keeping the agent and the people on one shared copy rather than trading files. Markdoc runs on the web and requires a GitHub account. Its integrations are GitHub-centric: gists and repository files for opening and publishing, and MCP for bringing your own agent into the document. The product is priced as free while in preview, with a GitHub account required to get started. Beyond Markdown, GitHub and the two editing surfaces, no further stack details are stated in the available content. For anyone who writes in Markdown and needs other people — or agents — in the document, Markdoc combines live two-surface editing, threaded comments, tracked suggestions, automatic version history and GitHub-native publishing in a single shared editor. The takeaway is simple: Markdown stops being a file you pass around and becomes a document you work on together.
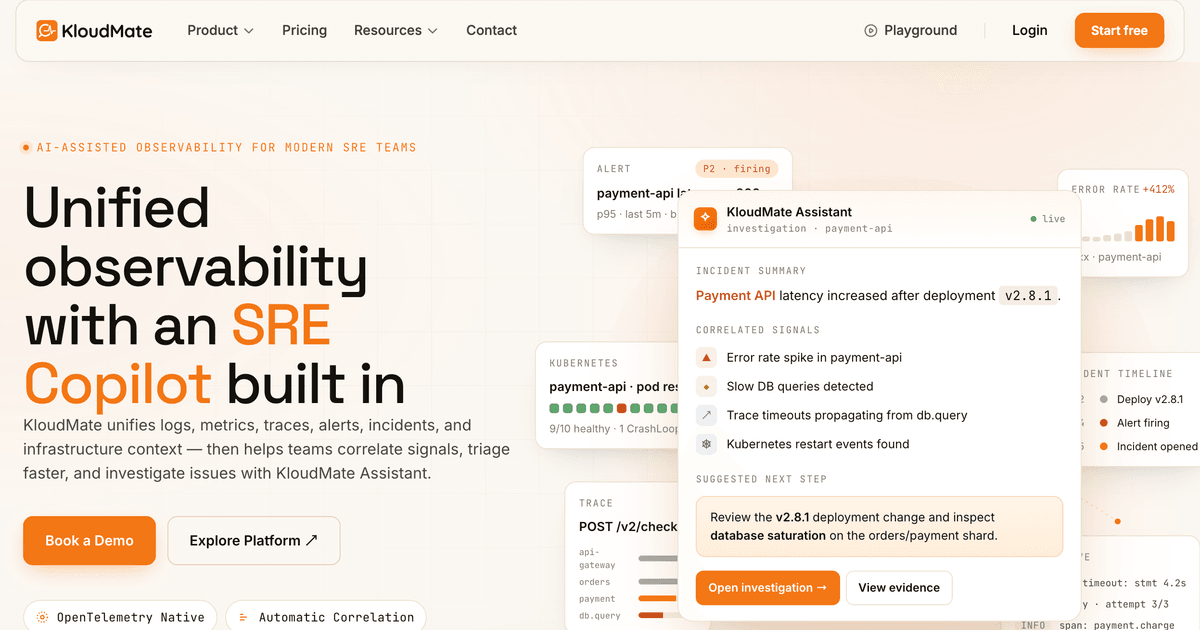
KloudMate is an AI-powered, full-stack observability and SRE-ops platform that brings logs, metrics, and traces together in a single place so engineers can find and fix production issues without jumping between tools. Its headline promise is unified observability with an SRE Copilot built in: rather than treating telemetry as separate silos, KloudMate connects alerts, signals, incidents, and infrastructure context into one investigation flow. The platform pairs a complete observability stack — log management, infrastructure monitoring, APM and distributed tracing, alerting, incident and on-call management, synthetic monitoring, and Kubernetes and infrastructure monitoring — with KloudMate Assistant, an AI module that summarizes, correlates, and guides response workflows. KloudMate is described as built for modern, distributed systems and is aimed at SRE and platform teams who need production visibility from telemetry collection through to incident response. The investigation problem KloudMate targets is simple to state and painful to live with: every signal lives in a different tool, so every incident becomes a manual hunt. Alerts tell you something is wrong, while logs, metrics, traces, incidents, and infrastructure events tell you why — but only when a team can connect them quickly. KloudMate describes three concrete symptoms of this fragmentation. First, signals are scattered: teams jump between dashboards, alert channels, logs, traces, and infrastructure views just to understand what changed. Second, triage takes too long: every incident begins with manual correlation, noisy alerts, and repeated context gathering across tools. Third, costs keep growing: as telemetry volume increases, fragmented observability stacks become harder to manage and more expensive to operate. KloudMate's answer is to bring these signals together and use KloudMate Assistant to surface context, correlations, and next steps during investigation. KloudMate Assistant is the platform's SRE Copilot, designed to move teams from alert to evidence faster. It correlates telemetry, summarizes incident context, highlights likely causes, and guides engineers toward the next useful investigation step. The Assistant's documented capabilities include automatic correlation — connecting alerts with related logs, traces, metrics, infrastructure signals, deployments, and incident activity — and AI-assisted triage, which summarizes what happened, what changed, and which signals are most relevant before engineers start digging. Guided investigation then helps teams identify where to look next using telemetry-backed context instead of guesswork, and the module also works to reduce alert noise by grouping related signals and incidents so teams can focus on the underlying issue rather than every symptom. A representative Assistant output shows an incident summary for a Payment API latency increase after a deployment, listing correlated signals such as an error-rate spike, slow database queries, trace timeouts propagating from the database query layer, and Kubernetes restart events, followed by a suggested next step to review the deployment change and inspect database saturation. The telemetry layer underneath the Copilot covers the three pillars of observability. Logs can be searched, filtered, and investigated with context from services, traces, infrastructure, and incidents, so a log line is never examined in isolation. Metrics monitor service health, infrastructure performance, SLOs, and custom metrics at scale. Traces, delivered through KloudMate's APM offering, follow requests across distributed systems to identify latency, errors, and dependency issues, and let engineers move between related telemetry signals during an investigation without losing service, request, or incident context. The product illustrates this with a checkout trace showing a total duration of 1.84 seconds across 27 spans with one error, breaking down time across a frontend proxy, a checkout API handler, a Redis cart lookup, an inventory API call, a PostgreSQL SELECT for items, a payments API charge, and a Kafka publish — exactly the kind of end-to-end view needed to see where latency actually lives. Beyond raw telemetry, KloudMate covers the operational workflows around it. Alerting lets teams build workflows that connect symptoms to context and route them to the right responder. Incident management and on-call handles routing alerts to whoever is on call, paging them by phone until someone acknowledges, escalating through further steps when there is no response, and keeping customers posted with a status page. The site illustrates this with an incident timeline: an alert page goes to the primary on-call engineer, goes unanswered, is re-escalated to the second step with additional engineers rung by phone, and is finally acknowledged when one of them presses a key on the call. Synthetic monitoring tracks user-facing availability and performance before customers report issues, adding an outside-in check on top of internal telemetry. Kubernetes and infrastructure monitoring gives teams a view of cluster, node, pod, and workload health alongside application telemetry, so infrastructure events — such as pod restarts and OOM-kill spikes — can be read in the same context as service errors. The overall investigation workflow ties the pieces together in five steps: an alert is triggered when KloudMate detects abnormal latency, error rate, resource saturation, or availability impact; signals are correlated as KloudMate links the alert with related logs, traces, metrics, infrastructure events, and incident activity; the Assistant summarizes context by highlighting what changed, what is affected, and which evidence matters most; the team investigates faster starting from a focused investigation path instead of manually searching across disconnected tools; and the response stays connected, with findings, ownership, timelines, and follow-up actions remaining tied to the incident context. The stated benefits centre on consolidation and predictability. KloudMate helps teams consolidate telemetry, alerting, incidents, and investigation workflows into one platform, reducing tool sprawl and lowering operational overhead while keeping observability costs predictable as telemetry volume grows. Being OpenTelemetry native means teams collect telemetry using open standards and avoid lock-in to proprietary agents. Cost efficiency is described as a platform design principle rather than an afterthought, and the platform's production-readiness is framed around real-time signal collection, on-call paging and re-escalation, and a workflow tuned for live incident response. Together these translate into less manual investigation time, one place to look during an incident, and a stack that scales economically with telemetry growth. Concrete scenarios described in the content include investigating a latency regression: an engineer asks why p99 latency on checkout jumped after a specific time, and the Assistant points to the inventory API deployment that landed minutes earlier, notes that the added latency sits on PostgreSQL SELECT spans inside a stock-lookup call, and suggests opening the relevant trace cluster and comparing database statements across versions. Another scenario is a payment API incident where an alert fires on p95 latency breaching its SLO and error rates climbing, and the Assistant assembles an incident timeline covering the deployment, the alert, and the opened incident along with correlated signals and a suggested next step. Other workflows include paging and re-escalating to on-call engineers until an incident is acknowledged, monitoring Kubernetes workloads for restarts and OOM kills, and tracking user-facing availability with synthetic checks. Teams also use KloudMate to consolidate fragmented logging, metrics, tracing, and incident tooling. KloudMate is built for modern SRE and platform teams operating distributed systems in production; the site shows engineers from companies including SprintMoney, Rocketium, Codeifai, Ostrum, Soffit, Microsoft, WeCheer, HealthifyMe, and Smartbox. On the technology side, the platform is OpenTelemetry native for telemetry collection and designed for Kubernetes, covering services, pods, nodes, clusters, workloads, and application telemetry together. The Product Hunt listing notes that KloudMate originally launched three years earlier as an AWS serverless monitoring tool and returns as a full-stack, AI-powered observability and agentic SRE-ops platform, with AI modules comprising Assistant (Answers), Builder (Dashboards, Alarms), Investigator (RCA), and Docs (Documentation). Access to the product is offered through a demo booking and an exploratory demo environment rather than a published self-serve pricing page. KloudMate's value proposition is straightforward: unify the signals that describe production, put an AI SRE Copilot inside the investigation workflow, and let teams move from alert to root cause without switching tools. By connecting logs, metrics, traces, alerts, incidents, synthetics, and Kubernetes and infrastructure context in one platform — and by using KloudMate Assistant to correlate evidence, summarize context, and suggest next steps — it aims to shorten incident triage, cut manual correlation work, and keep observability costs predictable as telemetry grows.
Claude Haiku 5.5 is Anthropic's fastest, cheapest, and most capable small model, announced on October 7, 2026. It is designed for high-volume, cost-sensitive tasks and reliably handles quick, repetitive workloads such as summaries, compactions, database queries, and classification requests. The model also pairs well with Anthropic's larger models, Opus 5.5 and Sonnet 5.5, acting as a subagent on coding work. Because it is Anthropic's fastest model to date, it is positioned for speed-sensitive workloads including live customer support and browser use, giving developers a small model they can run often rather than sparingly. The launch addresses a practical problem in production AI: many of the requests that dominate real traffic are short, repetitive, and narrow, yet teams have historically paid frontier-model prices to serve them. Anthropic notes that prompts up to 100,000 tokens make up around 90% of requests to the previous Haiku model, which means the bulk of day-to-day workloads are the kind that do not need a large model. Claude Haiku 5.5 is priced far lower than Haiku 4.5: on average, it now costs around 75% less to run. By footnote, it is priced 90% lower than Haiku 4.5 for requests up to 100,000 tokens and 50% lower for requests over 100,000 tokens. That calculation also accounts for the model's updated tokenizer, similar to those of Sonnet 5.5 and Opus 5.5, which uses slightly more tokens per task. Claude Haiku 5.5 brings substantial benchmark gains over Haiku 4.5 across knowledge work, computer use, reasoning, agentic coding, and visual reasoning. On GDPval-AA v2.1, a knowledge-work evaluation, it scores 1,620 versus 735 for Haiku 4.5, 1,437 for GPT-6 Luna, and 1,840 for Sonnet 5.5. On AA-Briefcase v1.1 it scores 1,578 against 614 for Haiku 4.5, 1,336 for GPT-6 Luna, and 1,824 for Sonnet 5.5. On the OSWorld 2.1 computer-use benchmark (offline subset) it reaches 72.4% versus 15.7% for Haiku 4.5, 48.9% for GPT-6 Luna, and 83.9% for Sonnet 5.5. On Humanity's Last Exam, a multidisciplinary reasoning test, it scores 45.9% without tools and 57.4% with tools, compared with 10.2% and 18.7% for Haiku 4.5 and 56.9% and 64.5% for Sonnet 5.5. On Terminal-Bench 4.0 agentic coding it scores 39.2% versus 0.0% for Haiku 4.5 and 70.6% for Sonnet 5.5, and on FrontierCode 1.1 (Main) it reaches 46.4%, while Chartography visual reasoning lands at 46.4% without tools versus 6.4% for Haiku 4.5. Full evaluation details are documented in the Haiku 5.5 System Card. Haiku 5.5 is the first Haiku-class model to come with an adjustable effort setting. As with Anthropic's other models, users can decide whether to optimize for cost or intelligence by choosing an effort level, with options charted across Low, Med, High, Xhigh, and Max. Anthropic publishes accuracy-versus-cost charts for three benchmarks at each setting: OSWorld 2.1 for computer use, GDPval-AA for knowledge work, and Humanity's Last Exam for multidisciplinary reasoning. OSWorld 2.1 measures how well agents can operate a real computer to finish long, multi-step tasks; GDPval-AA v2.1 evaluates agents on real-world professional work across 44 occupations; and Humanity's Last Exam tests expert-level academic knowledge and reasoning. This effort setting lets teams tune the trade-off between per-attempt cost and task accuracy without switching models or rewriting their workloads. Anthropic reports that Claude Haiku 5.5 shows major improvements across almost all of its alignment evaluations relative to Haiku 4.5, with far fewer instances of misaligned behavior and a lower willingness to cooperate with misuse; a dedicated system card describes the evaluation process and results in more detail. The model's cybersecurity safeguards are more restrictive than Haiku 4.5's but somewhat less restrictive than those applied to other recent models. In cybersecurity, they permit a wider range of defensive tasks than the safeguards for Sonnet 5.5 but still block penetration testing and other techniques more likely to be used by attackers. Its biology safeguards are the same as those for Sonnet 5, Sonnet 5.5, and Opus 5: they allow research biology questions but restrict access to requests judged likely to cause harm. Organizations working on wider-ranging biology and cyber activities can apply to the Life Sciences Verification Program and the Cyber Verification Program. The model's distinct approach is to combine a small footprint with a configurable effort dial and a clear role as a cost-efficient companion to larger Claude models. Anthropic explicitly frames Haiku 5.5 as best suited to more narrowly scoped tasks that might otherwise have been cost-prohibitive with previous versions of Claude, such as compaction, summarization, or subagent work, while Sonnet 5.5 and Opus 5.5 remain better choices for complex agentic coding tasks like those measured by Terminal-Bench 4.0. In practice this means a larger model can lead a task while Haiku 5.5 subagents handle the high-volume supporting steps. Anthropic also improved the value of its wider model range at the same time: Sonnet 5.5's cache reads were halved to $0.10 per million tokens, reducing the cost of Sonnet 5.5 on most agentic tasks by around 20%, and new monthly API credits were introduced for Max and Team subscribers. For users, the headline benefits are lower cost and lower latency at scale. The pricing table shows Haiku 5.5 at $0.01 per million tokens for cache reads on prompts up to 100,000 tokens and $0.05 over that, $0.125/$0.625 for cache writes, $0.10/$0.50 for input tokens, and $0.50/$2.50 for output tokens, against Haiku 4.5's $0.10, $1.25, $1.00, and $5.00. Early customer testing reported results consistent with the performance and cost improvements shown in the benchmarks. Asana measured over a 30% reduction in latency for task completions and up to 2.5x faster inference per agent turn. Box saw Haiku 5.5 score 11 points higher than Haiku 4.5 at about half the latency. The combination makes high-volume work affordable enough to run often rather than selectively. Anthropic and its early customers describe concrete workflows. AlphaSense's Ask in Document feature runs about 8 million calls a week in production answering very specific questions on top of one or a few documents; across 400 queries, Haiku 5.5 scored 0.84 versus 0.76 for Haiku 4.5. Box plans to use it on analytical work that runs at scale, from cost reports to financial summaries and weekly recurring reviews, across large volumes of enterprise content. HubSpot tests models on CRM tasks such as reporting on deals using simulated portals; Haiku 5.5 scored 92.8% averaged over three runs, the best result on that suite, and on a CRM audit task identifying stale but ambiguous records it was fastest to complete the task with the highest hit rate and the lowest false positive rate. Rogo uses it for quick lookups, subagents, and summaries, for example a Haiku 5.5 subagent pulling a segment revenue line from a 10-K while a bigger model builds the deck. Cognition offers Haiku 5.5 as a sidekick in Devin Fusion, holding a top-tier FrontierCode score of 66.2 while cutting cost and latency, available today in the Devin CLI with Opus 5.5 as the lead. Asana deployed it for AI Teammates use cases such as triaging bugs, setting up projects, and searching large portfolios to surface high-risk or overdue work. Claude Haiku 5.5 is available now on all platforms, including Amazon Web Services, Google Cloud, and Microsoft Azure, and developers on the Claude Platform can get started with the identifier claude-haiku-5-5; Anthropic provides a migration guide for details. For developers, Anthropic updated its Claude Python and TypeScript SDKs to add support for computer use and browser use in beta, noting that Haiku 5.5 is especially well-suited to these tasks given its combination of speed, capability, and price. Alongside the launch, Anthropic rolled out a new monthly API credit to Max and Team subscribers for use on the Claude Platform: Max 5x users receive $100 in credits per month, Max 20x users receive $200, and Team subscribers receive up to $500 pooled across their users. Credits can be used on any Claude model and are designed to let users experiment with building tools, apps, and agents that call the API. Claude Haiku 5.5's value proposition is straightforward: it is the cheapest, fastest, and most capable small model Anthropic has released, aimed squarely at high-volume, cost-sensitive work. With large benchmark gains over Haiku 4.5, an adjustable effort setting for tuning cost against intelligence, substantially lower token pricing, and availability across major cloud platforms, it gives teams a model they can run frequently for summarization, classification, lookups, subagents, customer support, and browser and computer use, while reserving larger Claude models for the most complex tasks.
DevAlly is an AI-powered accessibility compliance platform designed for product teams who ship quickly. Its stated goal is to make a product accessibility conformant fast, helping teams build products for everyone rather than treating accessibility as a one-off audit. The product covers the whole journey from scanning a live product URL through to documented proof of compliance. Central to the platform is the DevAlly AI Agent: when a user describes a user journey in plain English, the agent navigates the app and records that journey, and the platform then audits each stage of it against the WCAG criterion and suggests a fix for every issue found. DevAlly positions itself for teams that want end-to-end accessibility for any stage of product development, and it states that no accessibility expertise is needed to get started. Accessibility is no longer optional, and DevAlly frames the problem in explicitly regulatory terms. According to the platform, the US, the EU and the UK have each set their own accessibility requirements, and the direction is the same: mandatory, enforceable, and increasingly expected by the enterprise customers you are selling to. In the United States, VPATs are required for federal procurement under ADA and Section 508 and are increasingly expected by enterprise buyers, while ADA Title III exposes private businesses to civil lawsuits. DevAlly notes that demand letters, class actions and settlements are rising every year, that thousands of lawsuits are filed annually, and that settlements often exceed $50,000. The company's message is blunt — the market will not wait, and neither should you. Because products change constantly, accessibility requires consistent monitoring rather than a single audit, which is the gap DevAlly's agent is built to close. Teams are told they can own accessibility compliance without slowing down the roadmap: DevAlly handles the auditing, the prioritisation and the documentation, while the team handles the building. DevAlly's workflow is organised into five stages: Scan, Identify, Remediate, Prove and Scale. Scan is the entry point — a team signs up and runs a first automated audit in under ten minutes, with no configuration required, by entering their product URL. Identify then organises what the scan uncovered, prioritising issues by severity and by compliance standard so that necessary fixes come first rather than nice-to-haves. This prioritisation matters because remediation backlogs are usually long; ordering them by regulatory weight and severity lets a team work on the issues with the most legal and user impact before spending time on cosmetic problems, and it means a team without accessibility specialists still knows where to start. Remediate is where DevAlly's AI generates exact, code-level fixes. Those fixes are integrated directly into GitHub and into the team's CI/CD pipeline, so issues are caught before they ship rather than after release. This integration is what separates the platform from a standalone audit report: instead of handing engineers a list of violations to interpret and triage manually, DevAlly produces concrete changes in the same tools and repositories the team already uses, keeping accessibility work inside the normal development workflow. Catching issues before they ship also avoids the compounding cost of fixing accessibility problems after they have reached production and real users. Prove covers documentation. When procurement, legal or a customer asks, DevAlly provides VPATs, compliance dashboards and accessibility statements on demand, so the evidence is ready rather than assembled under pressure. Scale addresses the fact that accessibility erodes as products evolve: continuous monitoring catches regressions before users do, with the stated aim that accessibility stays built in rather than bolted on. Together these stages mean a single platform moves a team from a first scan to ongoing, documented compliance, with each stage feeding the next. The distinctive part of DevAlly is the DevAlly AI Agent and its natural-language approach to testing. Rather than hand-authoring scripts or clicking through a product manually, a person describes a user journey in plain English. The agent navigates the app and records that journey, which DevAlly says saves hours of engineering work. The platform then audits every stage of that recorded journey against the WCAG criterion and suggests fixes for each issue. DevAlly has also introduced an MCP that brings accessibility compliance into the editor, letting a developer ask what is failing WCAG and get the fix without leaving their workflow. Combined with the scan-to-scale workflow, this describes a methodology where testing is described rather than coded, issues are prioritised by compliance weight, fixes are generated and delivered into the development pipeline, and evidence is produced continuously rather than at the end. For users, the promise is owning accessibility compliance without slowing down the roadmap. DevAlly handles the auditing, the prioritisation and the documentation, while the team handles the building. Teams get a first automated audit within minutes of sign-up, fixes surfaced in severity order, code-level remediation delivered into GitHub and CI/CD before release, and compliance documentation available on demand when a buyer, lawyer or procurement team asks. Because monitoring is continuous, accessibility is treated as an ongoing part of shipping rather than a periodic project, and regressions are caught before users encounter them. Typical scenarios follow the platform's own stages. A team entering a new market can run a scan and identify the issues that matter most for that standard. An engineering team can wire DevAlly into GitHub and CI/CD so accessibility issues are caught before they ship. A company facing a VPAT request from a federal agency or an enterprise buyer can use Prove to generate documentation on demand. A product team can use the AI Agent to describe a critical user journey in plain English and have it recorded and audited stage by stage against WCAG. Developers can use the MCP to ask what is failing WCAG from inside their editor and get the fix without leaving the workflow. DevAlly is aimed at product teams who ship quickly, including the engineering, design and compliance functions that need accessibility handled without becoming accessibility specialists. Explicitly mentioned integrations are GitHub, the team's CI/CD pipeline and an MCP for editors. The platform is web-based: visitors enter their product URL or sign up through app.devally.com, with a free start and no credit card required, alongside a Request a Demo path. DevAlly has been featured in TechCrunch, Fortune, The Irish Times, Irish Independent, ThinkBusiness, The Currency, Web Summit, Tech.eu, Silicon Republic, RTÉ and Business Post. DevAlly's core value proposition is straightforward: make accessibility conformance fast and continuous for teams that ship quickly. By combining an AI agent that records user journeys from plain-English descriptions, audits each stage against WCAG, generates code-level fixes, and produces compliance documentation on demand, it aims to turn accessibility from an occasional audit into a built-in property of the product.
Figma Agent is an AI agent that lives directly on the Figma design canvas, allowing designers and product teams to prompt, edit, and prototype without ever leaving the canvas. Unlike tools that operate on flat images, Figma Agent works with your real components, variables, and team files, so the work it produces is connected to the same system your team already uses. Figma describes itself as the collaborative canvas for design, code, and AI—a single place where design, code, and AI come together so a whole team can go from first idea to shipped product, from concept to production, in one place. The challenge this addresses is familiar to any product team: design, feedback, and engineering context tend to live in scattered tools, and moving between them breaks momentum and loses detail. Figma positions the canvas as one workspace for the entire product development process, "made so your whole team can go from WIP to ship, together." Rather than exporting a design and pasting it into another assistant, or handing off static screens that ignore the underlying design system, teams can keep teammates and AI agents working in the same space with shared context. On Figma's AI-native canvas, the goal is to generate new ideas, refine them, and align—together—so that ideas no longer have to wait their turn and the flow from idea to review stays intact. Because teammates and agents share the same context, the handoff between exploration and review happens in the file rather than across disconnected tools. The core capability of Figma Agent is prompt-driven creation on the canvas. You can ask the agent to generate layout directions and explore multiple approaches quickly, then refine them. Because the agent operates on your real components and variables rather than flat images, the layouts it produces respect the building blocks your team already maintains, which reduces the cleanup work that typically follows AI-generated output. This makes early exploration faster while keeping the results closer to something production-ready, and it means the agent's output is grounded in the design context your team has already established. Figma Agent also handles bulk editing across screens. Instead of manually selecting and adjusting elements one screen at a time, you can apply changes across multiple screens in a single pass. This is especially useful for design systems work, where a small change—say to spacing, a variable, or a component property—can have wide-reaching effects. The agent can also turn comments into changes, converting feedback left on designs directly into edits, which shortens the loop between review and revision and keeps the conversation connected to the artifact being discussed. Turning comments into changes means review input becomes tangible updates in the same file, rather than a separate list of notes to interpret later. Beyond editing, Figma Agent supports prototyping from a prompt, so you can move from an idea to an interactive prototype without leaving the canvas. Figma frames the agent as a "built-in creative collaborator": you can ask Figma's agent to add motion to designs, document your design systems, implement feedback, and more. Adding motion helps communicate how an interface should feel, documenting design systems keeps that knowledge accessible, and implementing feedback turns review input into tangible updates—all through the agent rather than a separate workflow. The motion timeline and other technical tools described on the canvas support refining how designs behave, not just how they look. Figma Agent extends beyond the canvas through integrations. It can pull context from Notion, Slack, GitHub, and Linear via MCP, connecting design work to the documents, conversations, code, and issues that surround a product. You can also build your own plugins and shaders, extending what the agent and the canvas can do, and save repeatable workflows as skills your team runs with a "/" command. That last capability matters because it lets teams capture their own processes—like a recurring way of implementing a particular kind of feedback or documenting a component—and reuse them consistently. Pulling context from tools like GitHub and Linear keeps design decisions connected to the code and issues they relate to, while Notion and Slack context keeps the surrounding documentation and conversation in reach. The underlying approach is what Figma calls the AI-native canvas: teammates and AI agents work in the same space with shared context, rather than the agent being a separate chat window disconnected from the file. Design context stays connected to the codebase and to agents, so—as Figma puts it—"what you design is what gets shipped." Figma also emphasizes that you "start with design context" and "build with consistency," meaning the agent leans on existing components, variables, and files instead of generating isolated artifacts. The canvas is described as powerfully expressive and incredibly precise, offering the technical tools needed to dial in details—such as precise accessibility and precise padding—while the motion timeline and advanced effects support refining how designs behave. Additional canvas capabilities described in the content include glass depth, brush strokes applied to type, cursor vector editing, variable type, and type on a path. For users, the benefits center on staying in flow. Because prompt, edit, and prototype all happen on the canvas, there is less tool-switching and less context loss between idea, design, and review. Teams can generate and refine ideas together, incorporate feedback faster by turning comments into changes, and keep their output aligned with the real design system. The result Figma describes is a more transparent, open, and honest process: as Francisco Seiz, Senior Design Director at Code and Theory, notes, "Everyone is able to influence, inspire, and give input without ever leaving the design file." Concrete scenarios include generating several layout directions for a new screen and comparing them; applying a design-system change, such as a variable or spacing update, across many screens at once; turning review comments into edits so feedback is addressed in place; building a prototype from a prompt to explore interaction ideas; adding motion to a design to show how it should feel; and documenting a design system so it stays understandable. Teams can also create skills for recurring workflows and run them with a "/" command, and pull in context from Notion, Slack, GitHub, or Linear when a design task depends on documents, conversations, code, or issues. Designers can also turn to Figma's community templates—UI kits, websites, social media graphics, mobile apps, presentations, wireframes, illustrations, portfolios, web ads, and icons—as starting points alongside the agent's generated work. Figma Agent is aimed at design and product teams—designers, and the broader group Figma calls "your whole team"—who work on apps, websites, and products and want to move from WIP to ship together. It is relevant to organizations of significant scale: Figma states that 95% of the Fortune 500 uses Figma, based on data from March 2025, and its logos include Airbnb, Atlassian, Dropbox, Duolingo, GitHub, Mercado Libre, Microsoft, Netflix, Pentagram, Slack, Stripe, The New York Times, and Zoom. Documented integrations named for the agent include Notion, Slack, GitHub, and Linear via MCP. Pricing details are not specified in the available content. Figma Agent's primary value proposition is keeping prompt, edit, and prototype work on the same canvas as your real components, variables, and team files. By connecting teammates, AI agents, design context, and code in one place, it aims to help teams move fast in the right direction—from first idea to shipped product—without leaving the flow.
Alkera is an agentic data platform that brings data engineering, analysis, and science into collaborative multiplayer workspaces shared by both humans and agents. The product is also known through Databench by Alkera, described on Product Hunt as the open-source, multiplayer workspace for data science, analytics, and engineering. Its stated purpose is to cover an entire data stack within one agentic platform, letting data teams collaborate live alongside teammates and agents in notebooks and chats, run any cell or agent on a laptop, another computer, or a GPU node, launch many agents in parallel to explore ideas, and trace every result back to the data and code behind it. Alkera presents itself with a single headline: 'One agentic platform. Your entire data stack.' The three disciplines it names — data engineering, analysis, and science — have historically been handled in separate tools and by separate specialists. Alkera's stated approach is to place all three in shared, multiplayer workspaces where humans and agents work together rather than in isolation. The platform leans heavily on two related concerns. The first is trust: the Product Hunt description states that every result traces back to the data and code behind it, and the site demonstrates column-level lineage across warehouse, transformation, and analysis layers, plus knowledge entries that display their sources and whether they are human-verified. The second is safety: Alkera demonstrates testing changes safely in sandbox environments, so edits to pipelines can be examined before they are relied upon. The marketing language around the product frames these qualities as confidence and speed for an agentic data stack. The core surface for this collaboration is the notebook and the chat. In the demonstration shown on the Alkera homepage, a user named Priya asks a Signals agent, 'Can you chart monthly revenue by segment for this year?' The agent reports that it used two notebook tools and ran q3-revenue.alknb.py, three cells, finished. A second teammate, Marcus, then asks whether the analysis can be split by region as well; the dbt agent replies that it is adding a region facet to the trend chart and reports editing q3-revenue.alknb.py, one cell. The resulting chart is titled 'Monthly revenue by segment,' uses month, revenue, and segment fields, includes a tooltip and a facet, and renders enterprise, mid-market, and SMB series across the months of the year. Notebooks therefore appear as ordinary files in the workspace with an .alknb.py extension, and both humans and agents can read and modify them in the same live session. Alkera maintains a dedicated features page for notebooks and dashboards, indicating that dashboards are a first-class part of the same workspace. Agents in Alkera are not confined to a hosted environment. The Product Hunt description states that a user can run any cell or agent on their laptop, another computer, or a GPU node, and launch many agents in parallel to explore ideas. The homepage illustrates this with a training notebook that builds a Llama-style model configuration — hidden size 2048, 24 hidden layers, 16 attention heads, and a maximum position embedding of 4096 — wraps it in FSDP with a bf16 mixed-precision policy, and runs a training loop with gradient clipping and a scheduler, charting pretraining loss against tokens for train and validation splits on 8x NVIDIA B200 hardware. The same interface shows which model powers an agent: the chat panel displays Claude Opus with a 'High' setting and an 'Ask first' permission mode, and agent messages carry small indicators of what the agent did, such as using two notebook tools, running three cells, or editing one cell. Trust in results is a recurring theme. Alkera's stated position is that every result traces back to the data and code behind it. The site demonstrates column-level lineage across warehouse, transformation, and analysis, which lets a reader follow a column from where it is stored, through the transformation that produced it, into the analysis that consumes it. The knowledge base behaves similarly: each knowledge entry shows its sources and whether it is human-verified, so a reader can see not just the answer but where it came from and whether a person has vouched for it. Alongside these, Alkera demonstrates testing changes safely in sandbox environments, giving teams a way to try modifications without committing them to the live stack. Together these features form a provenance story in which code, data, and knowledge all carry visible evidence of their origin. Alkera's distinguishing approach is to treat agents as first-class participants in the data workspace rather than as a separate assistant window. Agents are given notebook tools, so they can run cells, edit files, and generate charts directly inside the same document a human is working in. The charting interface shown on the homepage, alkera.chart(revenue).line(x='yearmonth(month)', y='sum(revenue)', color='segment').title('Monthly revenue by segment').tooltip().facet('region'), illustrates the style: concise, chainable methods for line charts, titles, tooltips, and faceting. Because agents act on the notebook itself, their work is visible and reviewable in the same place as a teammate's. The platform is also designed to sit on top of the tools a team already uses. Alkera publishes a plugins and connections reference and lists supported systems spanning orchestration, transformation, analytics databases, lakehouses, data warehouses, query engines, business intelligence, knowledge sources, issue tracking, observability, data ingestion, code and CI/CD, communication, and object storage. The benefits Alkera describes center on confidence and speed. Speed comes from parallel exploration: many agents can be launched at once to investigate ideas, and individual cells or whole agents can be dispatched to a laptop, another machine, or a GPU node, so heavy work does not block the interactive session. Speed also comes from having teammates and agents in the same notebook and chat, which removes the need to hand results between separate tools. Confidence comes from traceability. Because every result links back to the data and code behind it, and because lineage is exposed at the column level, a reviewer can check how a number was produced rather than accepting it on faith. Knowledge entries that display their sources and verification status serve the same purpose for documentation, and sandbox environments allow changes to be validated before they matter. Concrete scenarios are visible throughout the material. A data team can ask an agent to chart monthly revenue by segment for a year and then extend the same chart with a regional break, which is exactly the sequence demonstrated on the homepage. An engineer can run a distributed training job — the FSDP and B200 example — and watch pretraining loss as training progresses. An analyst investigating a surprising figure can follow column-level lineage back through the transformation layer into the warehouse to find where the value originated. A team planning a pipeline change can rehearse it in a sandbox environment first. Anyone maintaining internal documentation can build a knowledge base whose entries show their sources and whether they have been human-verified. And a team with an existing stack can bring Alkera in alongside the orchestration, warehouse, transformation, and business intelligence tools already in use. Alkera is aimed at data teams: data scientists, analytics and data engineers, and the broader group of people who do data engineering, analysis, and science. Its Product Hunt topics are Open Source, Artificial Intelligence, and Data Science, and because Databench is open source, teams can either use Alkera's hosted offering or host Databench themselves from its GitHub repository. Pricing starts free: the site offers a 'Start for free' call to action, the Product Hunt listing mentions a generous free tier, and there is also an option to book a demo with the founders. The platform runs on the web and is designed to connect to the tools a team already uses, with a published list that includes Airflow, dbt, ClickHouse, Databricks, DuckDB, generic SQL, Google Docs, Linear, MySQL, PostgreSQL, Sigma, Snowflake, Tableau, AWS, BigQuery, Confluence, Datadog, Fivetran, GitHub, Hex, Looker, Notion, Redshift, Slack, SQLite, and Trino. Security, privacy, and terms documentation are published at dedicated links. Alkera's proposition is straightforward: one agentic platform covering an entire data stack, with collaborative multiplayer workspaces where humans and agents share notebooks and chats, agents that can run anywhere from a laptop to a GPU node and in parallel, and results that always trace back to the data and code behind them. For data teams that want the speed of agent-assisted exploration without giving up visibility into how results were produced, that combination of multiplayer collaboration and end-to-end traceability is the core value.
ButterShare offers a direct, peer-to-peer file transfer solution that bypasses cloud storage and eliminates file size limitations. This browser-based tool enables users to send anything, from photos and 4K videos to entire folders, directly between devices. Unlike traditional services, ButterShare does not require any signup or account creation, making the process quick and accessible for everyone.The core functionality of ButterShare relies on WebRTC technology to establish an encrypted connection between the sender and receiver. Files are streamed in real-time and written directly to the recipient's disk using the browser's Origin Private File System (OPFS). This direct streaming method ensures high transfer speeds and maintains the privacy of your data, as files do not pass through any third-party servers or cloud storage during a direct connection.ButterShare supports a wide range of devices and modern browsers, including Windows, macOS, Linux, iOS, Android, and ChromeOS. While Chromium-based browsers and Firefox offer the most robust experience with OPFS disk streaming for large transfers, Safari also supports transfers with browser memory constraints. The service is designed for simplicity, featuring a streamlined three-step process: choose files, share a link, and stream directly. This eliminates the need for manual zipping or waiting for upload queues.Security is a key aspect of ButterShare. All data transferred is end-to-end encrypted, with cryptographic keys held exclusively by the two connected devices. Even if a direct connection fails and the transfer falls back to a TURN relay, the traffic remains encrypted. Furthermore, ButterShare supports resumable transfers, allowing sessions to be continued if the connection drops mid-transfer, with checkpoint data stored locally in the browser. This makes it a reliable option for sending large files without interruptions.
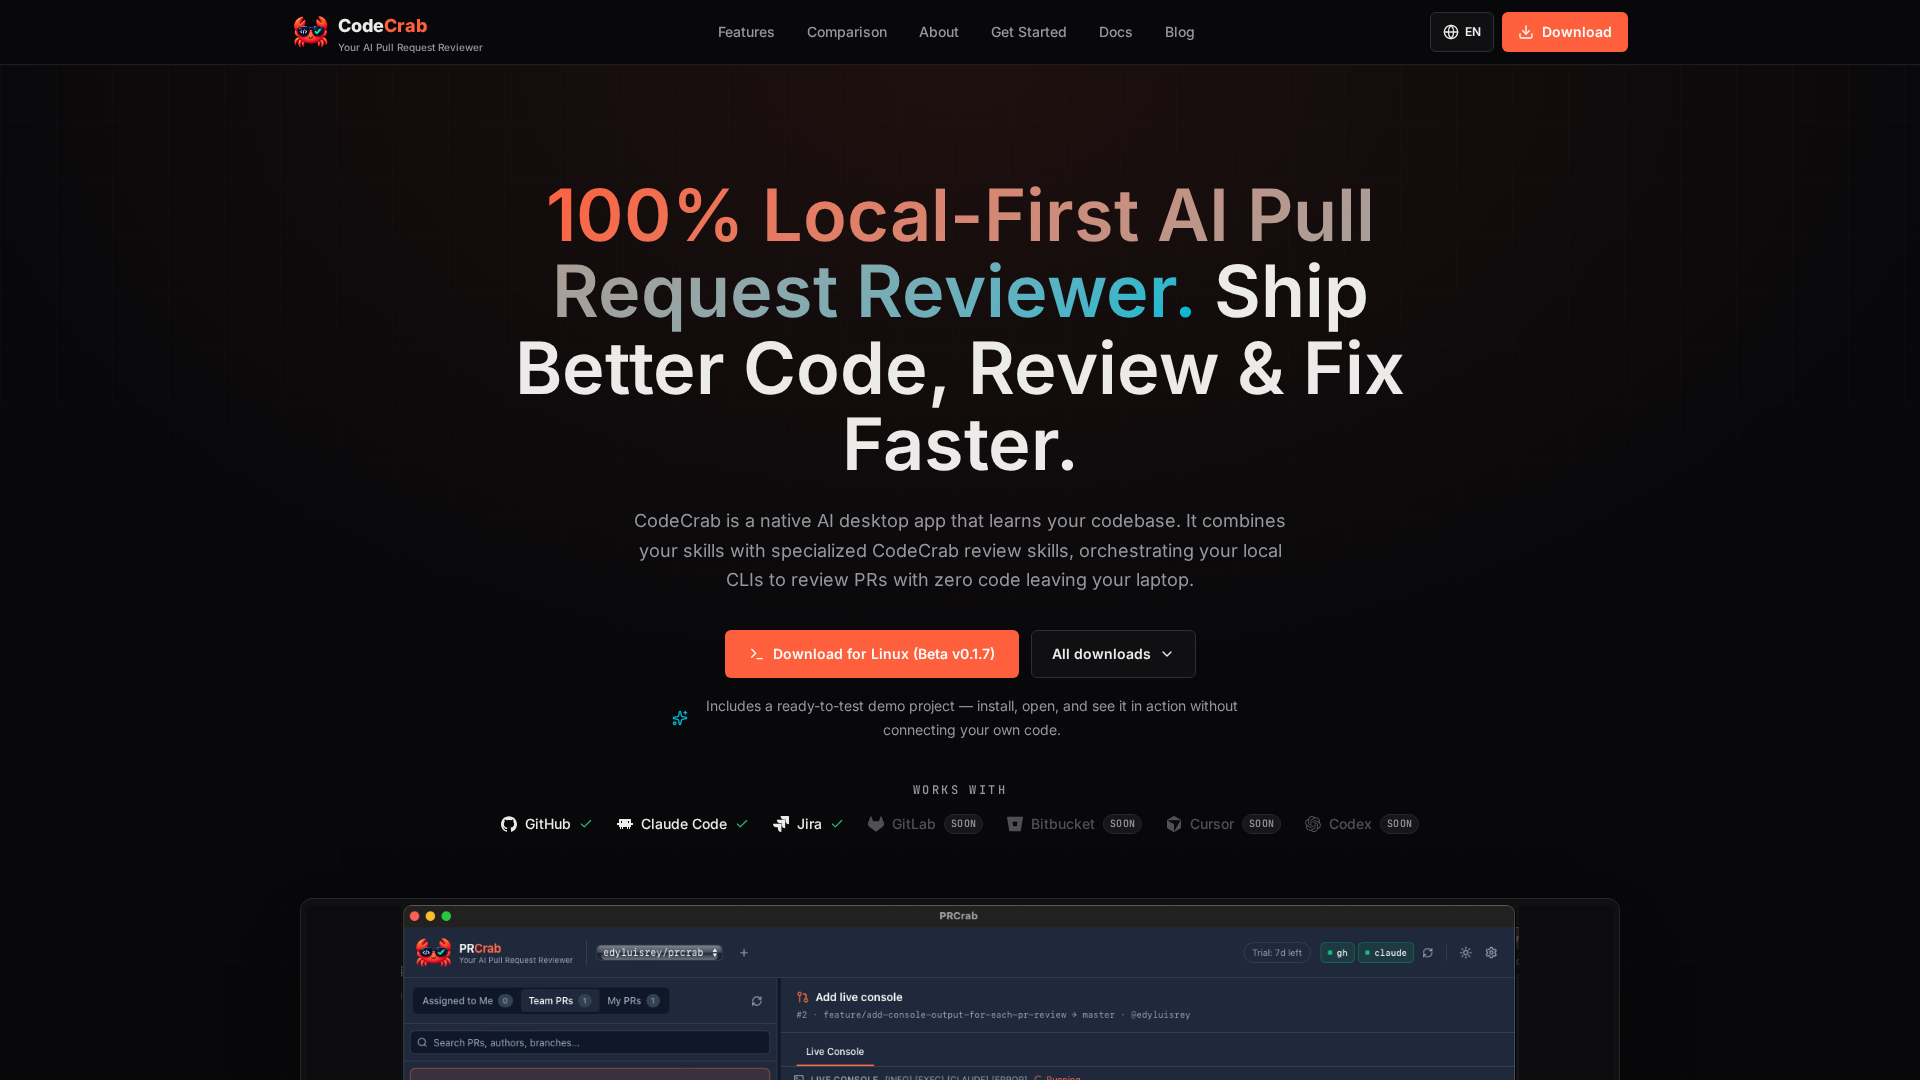
CodeCrab is a native, local-first AI desktop application that reviews pull requests in seconds by orchestrating the CLIs already installed on your machine. It is built for software engineers who review code daily and want to move faster without sending a single line of their source code to a cloud service. The app learns your codebase, combining the skills you already use with specialized CodeCrab review skills, and applies that understanding across three main moments in the development workflow: reviewing a teammate's pull request, responding to feedback on your own pull request, and reviewing local changes before a pull request even exists. Everything runs client-side on your laptop, and the product is currently available as a free public beta for Linux. The problem CodeCrab addresses is the shift in the engineering bottleneck. As AI toolsets generate code at unprecedented speeds, the author of the product — a software engineer with more than 14 years of experience, including years building systems at Google and Pinterest — observed that the primary constraint moved from writing code to reviewing pull requests efficiently. Deep review is hard: reviewers must hold full repository context in mind, evaluate diffs, and catch logic bugs, risky patterns and regressions before approving. Cloud-based review bots add a second concern: to review your code, they require your source to be uploaded and processed on vendor cloud servers. CodeCrab was built initially as a personal tool to perform deep, Staff-level code reviews fast, without uploading sensitive private code to third-party servers. When you open a pull request from a colleague, CodeCrab walks through the diff with you and maps AI observations directly onto the changed lines, so you can catch bugs, risky patterns and regressions before hitting "Approve". The review is not limited to the diff itself: CodeCrab reviews against your entire local repository, including types and the test suite, so its observations account for full codebase context rather than isolated changed lines. Because the review is 100% local-first, it can detect logic bugs and regressions without uploading a single line to the cloud. The live review interface shows a file tree, a diff viewer and inline AI observations, and features clear changed-file tracking with inline observation badges for clean multi-file diff inspection and precision navigation. When a teammate leaves an observation on your own pull request, CodeCrab runs a deep investigation for you. It digs through the code around every comment, connects that code with your project's context, and helps you understand — as precisely as possible — what the observation really means and what the correct solution looks like. The investigation is deep and read-only, covering every reviewer observation on the diff, so nothing changes on your branch while you are still reasoning about the feedback. From there, CodeCrab can propose an assisted fix on your local branch, and that fix is verified against your own test suite before it is applied. The result is a workflow that turns review comments into the right solution rather than a guess. CodeCrab also reviews your local changes before a pull request exists. While you are still working locally, you can run a read-only review of your in-progress changes; CodeCrab detects errors early, investigates every finding as deeply as needed, and helps you apply the right fix while the context is still fresh. Because this happens before anyone sees the diff, the pull request you eventually open ships cleaner, higher-quality code. The pre-push review keeps the same privacy posture as everything else in the app: your local changes are analyzed locally, so you get early feedback without exposing unfinished work to a cloud service. The product describes this as catching bugs before the pull request even exists. CodeCrab is designed to plug into your existing workflow rather than replace it. Connect any repository and CodeCrab learns its rules and patterns, building a per-repo review profile that powers specialized review agents and custom skills. That means reviews are tuned to your codebase, and your own local skills can be reused, combined with CodeCrab's skills, and extended as far as you need. The app integrates with GitHub, Claude Code, Jira and GitLab today, with Bitbucket, Cursor and Codex listed as coming soon. Under the hood, CodeCrab orchestrates your local CLIs: it uses your own GitHub CLI login (gh) rather than requiring org-wide OAuth admin permissions, and it works with your local Claude Code and Cursor setups instead of locking you to a vendor's fixed model wrappers. A Live Execution Console displays real-time stdout and stderr, so the execution pipeline is transparent rather than an opaque black box. Privacy is the product's core promise. CodeCrab uses a 100% on-device architecture with zero-code uploads: your source code never leaves your laptop or passes through external cloud databases, and the product is described as compliance-ready for strict corporate environments where no code may be sent to third-party AI clouds. Control follows from that architecture: CodeCrab is read-only by default and never commits, pushes, or posts public GitHub comments without your explicit permission. When it does propose changes, it runs your native test suite — cargo test, pytest, npm test — before applying them, and it offers 1-click local fixes in the form of verified code patches ready to apply directly to your local branch. The app is a native desktop application with instant, lightweight performance, minimal RAM consumption and instant startup. Economically, it reuses what you already pay for: it connects directly to the tools and subscriptions you already own, such as Claude Code and Cursor, and it gives you full model and cost control so you can choose which AI models to run and control exactly how much you spend on code reviews. These capabilities map onto concrete moments in a day-to-day engineering workflow. In a typical review cycle, a developer opens a colleague's pull request in CodeCrab, walks the diff with inline AI observations mapped to the changed lines, and reaches an approval decision with full repository context rather than a diff-only view. On the other side of the same workflow, a developer whose pull request has received reviewer comments uses CodeCrab to investigate each observation deeply in read-only mode and then apply an assisted fix on the local branch, verified against the test suite. Between those two moments, the pre-push review covers local, uncommitted work so errors are found before the pull request exists. Teams working in strict corporate environments use the same app because no code is uploaded anywhere. And for anyone evaluating the product, the bundled demo project lets you install, open and see it in action without connecting your own code. CodeCrab is a native desktop application, currently distributed as a free public beta, with a Linux download available at Beta v0.1.7 (amd64 AppImage) and additional downloads listed on the site. It is the product of an engineer named Edy, who has more than 14 years of experience, including years building systems at Google and Pinterest, and who describes CodeCrab as initially a personal tool that is now being actively refined during public beta based on real engineering workflows. The product integrates with GitHub, Claude Code, Jira and GitLab today, with Bitbucket, Cursor and Codex listed as coming soon. Its stated points of integration include your local Claude Code and Cursor setups, your local custom skills, the GitHub CLI (gh) for authentication, and native test runners such as cargo test, pytest and npm test. CodeCrab's value proposition is narrow and clear: it brings deep, fast, local AI pull request review to a desktop app that never uploads your code. By orchestrating the local CLIs and subscriptions you already own, mapping observations onto your diffs, investigating reviewer feedback deeply, and verifying fixes against your own tests, it accelerates review without asking you to trade away privacy or control. For engineers and teams who care where their source code ends up, CodeCrab offers the same kind of review acceleration associated with cloud bots, delivered from a 100% client-side architecture.
Pheebs is an open-source telemetry tool built by Eversynced to understand how developers work with AI coding agents and what the models they run are costing them. It installs quietly inside the AI coding agents Claude Code, Cursor, and Codex through hooks, capturing lightweight interaction signals: the shape of the session, not its contents. Hooks and OpenTelemetry go in; honest proficiency reads come out. The product is built for teams that want an evidence-based answer to a simple question — how is AI coding actually being used here, and what is it costing? AI coding agents are fast and their output often looks polished, which makes them very hard to assess by feel. Polished output can hide missing verification. Over-provisioned models can burn budget without anyone noticing. Follow-up prompts spent repairing AI-generated breakage can look indistinguishable from healthy iteration unless someone measures them. The site frames this through a set of observations: model spend that buys nothing, where thousands of dollars of last month's model spend went to a bigger model than the work needed; AI code that ships unchallenged, where a majority of AI-written lines in a payments service shipped with no check; AI edits that never had a test, typecheck, or build run behind them; rework hiding inside the speedup, where follow-up prompts were fixing something the AI broke rather than moving the work forward; enablement skills that either caught on weekly or never caught on at all; and teams that never run tests inside the agent loop at all. On that last point the site is explicit — that is a missing harness, not a skills gap, and Pheebs is positioned to help teams tell which situation applies to them. Pheebs works with three coding agents: Claude Code, Cursor, and Codex. The client sits inside each agent via hooks, and the coverage spans 17 event types, from session_started through artifact_found. Events include session starts and ends, prompts, skill and slash-command expansions, sub-agent spawns, tool calls and failures, compaction, and background tasks. A sample Claude Code stream shows the granularity in practice: session_started with a codebase and model, prompt_submitted with a prompt length and intent label, tool_use_completed entries for an Edit and a Bash test run, context_compacted with a trigger type, and turn_ended with a background task count. Cursor connects through hooks, while Claude Code and Codex connect through hooks plus OpenTelemetry. Every field Pheebs records is deliberately lightweight, and the tool is explicit about what it never captures. Source code and file contents are never stored. File paths and directory structures are excluded, with a repository recorded only as org/repo from the git remote. Prompt text is never stored — a prompt becomes a character count, with an intent label added when the prompt intent classifier is enabled. Command strings are read in process, so npm test is recorded as tool_intent: test_run rather than as text. Names and emails are avoided: a developer is the id behind their Pheebs token, stamped by the backend, or a truncated hash of their git email when no token is set, and a GitHub handle is never looked up. The site sums it up bluntly: no code, no file paths, no stored prompt text — the shape of the session, never its contents. The capture pipeline is documented step by step. First, a hook fires. Second, lightweight fields are extracted: event type, durations, counts, models, and trigger types, with a prompt reduced to a character count and, when the prompt intent classifier is enabled, an intent label — the text itself is never stored. Third, identity and repo are resolved, using the developer id behind the token or a truncated hash of the git email, and the codebase as org/repo from the git remote. Fourth, every event is stored in a local JSONL log, and with a token set it also goes to the backend. Fifth, OpenTelemetry rides along: Claude Code and Codex export native OTel metrics and logs through the Pheebs proxy. The client offers four routes to any backend — self-hosted, or managed by Eversynced — and the local JSONL stays the durable copy either way. Configuration is deliberately minimal: set a base-url and set a token. Both need to be set or nothing is posted, and unsetting either one stops sending. The backend contract is documented, with a reference backend available in the Pheebs repo. POST /ingest carries one event envelope per request. POST /validate-token resolves a token to an identity and its consent flags. POST /classify-prompt takes one prompt in and returns one label, and it is the only route that receives raw text. POST /otel/v1/{signal} is an OTLP passthrough, so no observability credential ever ships in the client. GET /insights is optional and covers what one developer can see about their own work. On top of the raw events, Pheebs renders a proficiency model organized into six competency areas. Models covers which models are in play: model choice, effort settings, plan mode, and autonomy modes. Artifacts covers the reusable config that shapes the agent: skills, sub-agents, slash commands, and context files. MCP covers live connections to external systems such as tickets, databases, browsers, and documentation. Evals covers verification wired into the agent loop: tests, typecheck, lint, build, and review passes. Context management covers deliberate use of the context window, including compaction and the save, resume, and clear lifecycle. Orchestration covers more than one agent at a time: sub-agents, parallel work, worktrees, hooks, and plugins. Each competency is tracked in one of three states. Unobserved means the practice never showed up in the window. Adopted means it showed up at least once. Recurring means it showed up in at least three of the last four active weeks. The coverage index summarizes this per engineer as the share of applicable practices at Recurring. Alongside the competencies sit five judgement signals, split between output side and input side. On the output side, verification coverage is the share of AI edits followed by a verification action — a test run, typecheck, lint, build, or a check against a spec. Pushback rate measures how often the engineer challenges AI output instead of accepting it, a signal the site notes collapses exactly when output looks polished. Refinement-to-repair ratio distinguishes whether follow-up prompts refine intent (healthy iteration) or repair breakage (rework). Wholesale-accept rate captures sessions with no pushback, no repair, and no verification, weighted by lines changed — described as the composite red flag of polished output with no questions asked. On the input side, model-fit rate is the share of sessions whose model class matched the size of the work. Model-fit is the one signal with a price attached. A reporting view shows savings opportunity against list-price spend, contrasting the models used with the work as sized, and it carries a coverage breakdown — complete, incomplete, no telemetry, unpriced — because decisions and figures come from complete sessions only. Three principles govern the approach. Tasks are sized: every task prompt gets a scope, from a one-file change to open-ended design, and a session is judged on its hardest prompt. Misses count both ways: an over-provisioned session burns budget silently, while an under-powered one shows up as repair prompts. And Pheebs is an audit, not a router: it never intercepts a prompt or switches a model on anyone's behalf — it reads the gap and prices it, and the decision stays with the team. Reporting built on top of Pheebs renders the model in several views. A practice adoption funnel shows one bar per competency, split by how many engineers have not acted on it, acted once, or acted week after week, with Unobserved and Adopted flagged as the competencies to be intentional about. A practice heatmap puts every engineer against every competency; a cold column means the team is missing the setup and practice for that competency, which is described as a structural fix, while a cold row calls more strongly for coaching. A per-engineer view shows how much of each competency has become habit and sums it up in a coverage index that can be tracked over time. A signals-by-engineer table lists verification, pushback, refine-to-repair, wholesale accept, and model-fit per person alongside a team median. The guidance is direct: one weak number is a coaching conversation, but a weak column across the whole team is a structural gap. The sample views on the site are labeled illustrative data. Pheebs can be deployed in two ways. Self-hosted means you stand up the backend and telemetry goes from your developers' machines to your own infrastructure — Eversynced never sees it. That option includes the full client with all three agents under Apache-2.0, a documented contract and a reference backend in the repo, raw JSONL you can query with whatever you already use, and no account, no key, and no requests from Eversynced. Managed means Eversynced runs it, along with the reporting on top: the same open-source client pointed at an operated backend, with the proficiency model rendered as reports and dashboards. That is the AI Enablement Assessment service — a 30-day telemetry sprint that ends in an executive debrief and a plan for the gaps, including the model-fit gap priced in dollars from the team's real sessions, with insights tracked over time. Installation is a single npm command, followed by pheebs init for interactive setup across all three agents and pheebs doctor to check the wiring. In practice the product serves teams that want to see where AI budget actually goes, teams diagnosing whether weak AI results are a setup problem or a coaching problem, and individual developers who want their own honest read on their practice. Eversynced runs Pheebs on itself: every Eversynced engineer is instrumented with it, and it powers the measurement layer of the company's AI delivery framework, which is the same reporting that ships with the AI Enablement Assessment run for client teams. The takeaway is that Pheebs turns an otherwise invisible activity — how a team works with AI coding agents and what those agents cost — into measured, priced evidence. It does so without storing the work itself, and it leaves every decision with the team: an audit rather than a gatekeeper.