Category Focus/categories/developer-tools
Developer Tools AI Tools
Discover and compare the best developer tools AI tools and software. Browse 571+ curated tools with reviews and rankings.
Projects tracked
571
Sort mode
RECENT
Page
13
Discover and compare the best developer tools AI tools and software. Browse 571+ curated tools with reviews and rankings.
Projects tracked
571
Sort mode
RECENT
Page
13
FreeScan.app is a website audit tool that reviews any public URL across SEO, AEO, GEO, website security, accessibility, and design. It is built for builders, developers, and site owners who want to know what is hurting their visibility, trust, and conversions. A single scan runs 40 focused checks and returns scores, supporting evidence, prioritized fixes, and insights. The free audit requires no signup and no private access, so anyone can paste a public page and immediately see where the page stands and what to work on next. The stated purpose is to uncover problems and missed opportunities and turn them into an actionable plan rather than an unexplained score. Most site owners do not know which specific issues are holding a page back. Auditing normally means piecing together separate tools for SEO, security headers, accessibility, and design, then interpreting raw output without context. FreeScan.app addresses that fragmentation by running discoverability, security, accessibility, design, and page quality checks in one focused scan on one public URL. Every finding is paired with evidence and an explanation of why it matters, so the user can decide what to fix first. The site positions this as a way to stop guessing whether a page is crawlable, secure, accessible, clearly designed, or ready to convert before a launch, campaign, or SEO push. Running the free audit is deliberately simple. You paste any public page URL and start a scan without signing up or granting private access. The scan performs 40 focused checks across discoverability, security, accessibility, design, and page quality. Results are presented as four category scores — SEO / AEO / GEO, security, accessibility, and design — that can be compared side by side, plus an overall view. The report bundles scores, supporting evidence, prioritized fixes, and insights into one shareable audit report. Results are organized into three action-ready views: Fixes, which shows what is costing points, why it matters, and what to change first, ordered by impact; Opportunities, which surfaces high-leverage ways to improve visibility, trust, usability, and conversion beyond failed checks; and Insights, which explains what the page already does well, backed by rendered checks, schema, previews, and page signals. The SEO, AEO, and GEO portion of the audit covers technical SEO and answer-engine readiness. It reviews titles, meta descriptions, headings, canonical tags, robots.txt, sitemap.xml, structured data, Open Graph, internal links, llms.txt, and answer-ready page structure. The stated goal is to see whether the site is structured for search engines and AI answer systems to understand it. Pro extends this into site-wide AI visibility, where FreeScan.app looks for crawler blocks, content gaps, and citation-readiness issues across scanned pages, showing what needs attention for search and AI discovery. For teams tracking how generative and answer engines surface their content, these checks translate directly into specific pages and specific problems rather than a general recommendation to improve SEO. The security checks look at public website signals visible from the page: HTTPS, mixed-content indicators, common public security headers, insecure forms, sensitive file exposure, and cookie flags. The accessibility fundamentals check finds missing alt text, form labels, heading-order problems, landmark gaps, unclear controls, language issues, contrast risks, small tap targets, and rendered accessibility errors. The design evaluation is conversion-focused, assessing hero and CTA clarity, content density, trust signals, mobile viewport setup, readability, spacing, visual hierarchy, runtime health, performance, and layout stability. FreeScan.app is explicit that this is a focused public-page audit and not a replacement for expert SEO strategy, penetration testing, accessibility certification, or analytics, so the checks should be read as signals and starting points rather than formal certification. The methodology centers on evidence over totals. Instead of returning a single number, FreeScan.app attaches supporting evidence to each finding, explains why it matters, and states how to fix it — the site describes this as turning audit results into clear next steps. Findings are ordered by impact so the highest-value work is visible first, and the report includes practical next steps for every result, along with opportunities and insights derived from rendered checks, schema, previews, and page signals. Because the output is framed as fixes plus explanations rather than vague advice, results can be handed to a coding agent. Builders in community testimonials describe running a scan, giving the results URL to their agent, reviewing the pull request, and shipping — with accessibility scores moving from 72 to 100, or an overall page score going from 40 to 86 after working the list. FreeScan Pro is a single plan at $19 per month, cancellable at any time, that moves from a single page to the whole site. Pro runs automated site-wide audits and organizes results into SEO, AI Visibility, and Fixes workspaces in one private dashboard. A site-wide fix board groups findings from across the site into a prioritized board where you can see affected pages, track each fix, and give your agent the evidence to act. Agent workspaces let you export full SEO, AI Visibility, and Fixes workspaces as Markdown, and Pro MCP lets a coding agent read private findings and request rescans. Pro also audits key pages automatically each week, sends email reports, compares progress, monitors uptime, and supports an optional shareable status page. Stated limits include up to 60 baseline and 25 recurring pages, five sites, and five manual scans per week per site. FreeScan.app also publishes a leaderboard of the highest scoring Pro homepages, ranked by each website's latest homepage audit. Users come to FreeScan.app to find out what a page is missing and exactly what to fix. The stated outcomes are improved search rankings, AI visibility, user trust, and conversions. Because each failed check includes evidence and a concrete fix, teams can turn audit output into a work list — one testimonial describes shipping against the list like a sprint backlog and reaching 100 out of 100 across SEO/AEO, security, accessibility, and design. Pro adds tracking so you can see what improves and catch new issues as the site changes, with weekly audits, progress comparisons, uptime monitoring, and downtime alerts. Public, shareable audit reports also make it easy to show progress before and after a fix cycle. Together these turn a one-time score into an ongoing improvement loop for visibility and trust. The most obvious use case is running the free audit before a launch, campaign, or SEO push, so you do not guess whether a page is crawlable, secure, accessible, and ready to convert. Another is remediation with coding agents: scan a page, hand the findings or the results URL to an agent such as Claude Code, apply the suggested fix, and rescan to confirm. Teams also use it to check a single public URL for SEO, security, accessibility, and design issues and see what to fix first, and to review answer-engine and AI visibility signals such as llms.txt, structured data, and crawler access. For ongoing operations, Pro supports weekly site-wide audits of key pages, a fix board for tracking work across the site, and uptime monitoring with a shareable status page. FreeScan.app also publishes practical guides on website audit checklists, technical SEO audits, and auditing a SaaS website safely. The product targets builders, developers, indie makers, and website owners who ship sites and want fast, evidence-backed feedback, including teams working with coding agents. The audit is a web-based, public-page tool: you paste a URL and it scans, with no signup required for the free check. Pro is priced at $19 per month with cancellation at any time and covers up to 60 baseline and 25 recurring pages, five sites, and five manual scans per week per site. Integration points explicitly described are Markdown export of SEO, AI Visibility, and Fixes workspaces, connection through Pro MCP so agents can read private findings and request rescans, weekly email reports, and an optional shareable status page. The site also notes the tool complements rather than replaces expert SEO strategy, penetration testing, accessibility certification, and analytics. FreeScan.app gives anyone a fast, free way to see what a public page is missing across SEO, AEO, GEO, security, accessibility, and design, and exactly what to fix first. The free 40-check audit runs without signup and returns four category scores, prioritized fixes, opportunities, and insights in one shareable report. Pro at $19 per month turns that into whole-site monitoring: automated weekly audits, a unified fix board, agent workspaces and MCP access, private scan history, and uptime monitoring with status pages. For builders who need to know whether a page is crawlable, secure, accessible, and ready to convert — and who want evidence they can hand straight to a coding agent — FreeScan.app packages discovery, diagnosis, and next steps into one workspace.
Desert Ant Labs is building the intelligence layer for every app. Rather than one large model that tries to do everything, the company publishes a family of small, specialized AI models, each of which does one job very well across speech, text, and vision. The models are designed to run on-device — on a phone or in a browser — and are added to any product through one native SDK in just a few lines of code. The company's stated goal is "little brains in every product," giving developers the fastest model for their specific task instead of the overhead of a general-purpose model. The product addresses the cost and dependency that come with cloud-based AI. Because the models run on the device itself, they need no internet connection and involve no per-use or token cost. That matters for two reasons the site calls out directly: developers never have to meter their users, and sensitive data such as personally identifiable information can be filtered on the device instead of being sent away. The company explicitly positions its approach against using one big model for everything, arguing that small models dedicated to a single task deliver the fastest result for that task. Speech, text, and vision each get purpose-built models rather than a single general system. Speech is the deepest area of the model catalog. Voz handles speech recognition, transcribing ten minutes of audio in two seconds on an iPhone. Clear provides speech enhancement for studio sound without a cloud bill. Uhm detects and removes filler words in seconds, which is useful when cleaning up recorded conversations before publishing. Align produces accurate word timestamps for any transcript, even though it is listed more briefly than the others. Ear detects spoken language from 30 seconds of audio, while Tongue identifies language from as little as three words. Together these models cover the path from raw audio to clean, searchable, and well-labelled text, and each one runs on the device, so none of that processing depends on a remote service. On the text side, Gist generates topics and tags for posts and articles, helping content be organised and discovered. Title suggests a title and description for any text, cutting the friction out of publishing. Several models are marked as beta. Schemer performs structured extraction, turning any text into typed JSON, which is directly useful for developers who need machine-readable output from unstructured input. Moderator flags nudity before content is uploaded or displayed, and Toxic is built for hate speech triage, catching hate speech before it posts. Those moderation models are described as running on the device, so content checks happen locally rather than after the fact in the cloud. Vision and media tasks are covered as well. Shapes performs shape recognition, turning a rough sketch into a perfect shape, which suits drawing and design tools where users draw imprecisely and expect clean geometric output. Clips handles clip selection, creating short videos and highlight clips. Emo suggests emoji faster than a user can type, aimed at messaging and social products. Redact filters personally identifiable information on the device, a model the site presents alongside Clear as a way to process sensitive material locally rather than in the cloud. Each of these models is described in one line because each does one narrow job rather than many. The unifying mechanism is a single native SDK. The company describes it as one SDK that drops the models into any product in a few lines of code, which means a developer does not need a different integration for each capability. The models themselves are published on Hugging Face, the SDK is available on GitHub, and documentation is provided separately. Because inference happens on-device, the working method is local execution: the model runs on the user's phone or in their browser rather than calling a remote endpoint. That on-device approach is what removes the need for tokens, logins, and per-use billing from the developer's perspective. The stated benefits follow from that design. Speech enhancement delivers studio sound without a cloud bill; PII redaction keeps sensitive filtering on the device; and transcription is fast enough to process ten minutes of audio in two seconds on an iPhone. Developers can build without metering their users, and the pricing model reinforces this: every model is free up to 100k monthly active devices per platform, with no limit on how often each person runs it. The company frames the outcome simply — build your wildest ideas and best products, and never meter a user. Concrete scenarios follow from the model list. A recording or podcast app can run Voz to transcribe audio and Uhm to strip filler words before publishing, with Align supplying word timestamps for captions or search. A social or community platform can call Moderator before an upload is displayed and Toxic before a comment is posted, checking content on-device. A notes or publishing tool can use Gist for topic tags and Title for suggested titles and descriptions. A drawing app can use Shapes to snap rough sketches into clean shapes, while a messaging app can use Emo for emoji suggestions. A developer pipeline can use Schemer to extract typed JSON from unstructured text, and a privacy-conscious product can run Redact to filter PII locally before data leaves the device. The product is aimed at developers and product teams who are adding speech, text, or vision features to an app and want to avoid cloud costs, per-use token billing, and remote data processing. It is offered as an SDK, with the SDK available on GitHub, documentation on the company's site, and models published on Hugging Face, and it is listed under the topics Artificial Intelligence and SDK. On pricing, every model is free up to 100k monthly active devices per platform, and there is no limit on how often each person runs it. In short, Desert Ant Labs supplies small, task-specific AI models that run on-device and plug into any product through one native SDK. Fast transcription, speech enhancement, on-device redaction, clip selection, and a growing catalog of text and vision models — all free up to 100k monthly active devices per platform — make the pitch simple: the fastest model for the job, with no tokens and no meter.
AI Observability by OpenObserve is an AI and LLM monitoring product that traces every agent, tool call, and model request, scores quality on live traffic, and attributes cost to the token. It runs in the same platform that handles the rest of a team's production stack, is OpenTelemetry-native, can be deployed anywhere, and is priced per GB instead of per span. Its stated purpose is to show what agents are really doing: every agent session is traced across models, tools, services, datastores, and user sessions so teams can see exactly where time, money, and quality went. It is aimed at the people who operate agentic applications in production — developers, platform and SRE teams — and it also extends to evaluation and AI SRE workflows. The problem it addresses is that agentic applications are expensive and opaque. As OpenObserve frames it: your agent cost $40 and took 34 seconds — but why? A single request fans out into hundreds of spans, and most LLM tools are a silo bolted onto a real observability stack, metered per span and locked to one cloud. That metering model punishes exactly the workloads agentic apps create. Meanwhile, debugging a bad answer often means grepping logs to reconstruct what an agent did. OpenObserve positions itself as one platform for AI and everything under it: LLM traces land next to logs, metrics, traces, and RUM, so when an agent is slow you can see the pod, database, or vector store behind it — no second tool, no swivel-chair. Tracing and mapping work by treating every agent request as a distributed trace. OpenObserve maps each agent to the models, tools, services, and datastores it calls, with request counts and error health on every edge, so a runaway loop or failing tool is obvious at a glance. The Agent Graph renders the full call tree across sub-agents, tools, and models; border colors flag healthy, degraded, and critical paths by error rate; and filters by environment, agent, and version let teams compare releases. Session debugging opens any session and replays the whole conversation — every turn, every tool call, the model behind it, and where cost and latency actually went. Session ribbons break down cost, duration, and tokens per turn; tool, cost, and latency hotspots surface the expensive, slow steps instantly; and one hop takes you from a turn to its full distributed trace. Evaluations run continuously on production traffic. Online eval jobs score live spans, traces, or full sessions the moment they arrive, using LLM-as-judge with your own provider or a remote HTTP scorer. Built-in scorers cover relevance, hallucination, toxicity, bias, and more. You define a score config with a healthy threshold, choose a sampling rate — on a sample or on everything — and score at span, trace, or session scope. Score configs are versioned, and results roll up into a live Quality dashboard that flags what needs attention, replacing the one-off notebook approach to measuring model quality. The evaluation loop closes by turning production traces into test sets. Real traces can be routed into review queues where humans score them alongside the automatic evaluators, with reviewer scores layered over system scores. A single click distills a reviewed trace into a dataset that future versions can be tested against, and Discovery surfaces the failures worth reviewing in the first place. Agent Behavior catches loops and groups failures by kind. Together these steps connect what happens in production to the eval data used to validate the next release. Architecturally, AI and LLM traffic is a first-class layer in one unified stack: it is just another source flowing through the same correlation engine as the frontend, APIs, databases, and infrastructure. Traces, metrics, logs, LLM observability, evals, and AI SRE live in one platform and are queried together with SQL and PromQL. Instrumentation is standard: OpenObserve ingests OpenTelemetry gen_ai spans and OpenInference conventions, so instrumentation you already have keeps working and can be routed to OpenObserve, another backend, or both. The engine is a Rust engine on columnar Parquet storage and bills per GB. Deployments can be managed cloud, self-hosted single binary, bring-your-own-cloud, or bring-your-own-bucket, with federated search across regions and clouds while keeping egress controlled. The outcomes stated in the content are predictability and correlation. Because pricing is per GB ingested and queried rather than per LLM span, per unit, or per seat, agentic applications that fan out into hundreds of spans per request stay predictable instead of spiking the bill, and users are unlimited. Because LLM traces sit beside the rest of the stack, a slow agent can be traced to the pod, database, or vector store behind it without switching tools. Because evaluations run on live traffic against a healthy threshold, quality is watched continuously on a dashboard instead of measured once. Sampling eval jobs and redacting sensitive fields with VRL pipelines before storage help control cost and data exposure. Concrete scenarios include detecting a runaway agent loop: the Agent Graph shows a failing tool or loop at a glance. Replaying a bad answer: a session view shows every turn, every tool call, the model behind it, and where cost and latency went. Comparing releases: filters by environment, agent, and version expose regressions. Measuring quality in production: online evals score live traffic with LLM-as-judge or a remote scorer. Following a failure end to end: from the LLM call through the backend and database, alongside the logs, traces, and metrics from the rest of the production stack. And building eval datasets: routing real traces to annotation queues and distilling reviewed traces into datasets for testing future versions. Target users are teams running agents and LLMs in production — developers, platform and SRE teams, and organizations that need AI observability alongside their existing stack. Integrations are broad and OpenTelemetry-based: OpenAI (Python and JS/TS), OpenAI Assistants, Anthropic (Python and JS/TS), LangChain, Google Gemini, Amazon Bedrock, Mistral, Ollama, DeepSeek, Cohere, Groq, Hugging Face, vLLM, Together AI, Fireworks AI, and xAI Grok, with the FAQ citing coverage of LangChain, CrewAI, LlamaIndex, OpenAI, Anthropic, LiteLLM, and 80+ more frameworks, providers, and gateways. Deployment spans managed cloud in four regions (US East, US West, Europe, India), self-hosted as a single binary, bring-your-own-cloud, and bring-your-own-bucket. Management as code is supported via a Terraform / OpenTofu provider, with enterprise controls including RBAC and SSO. Plans listed include self-hosted Enterprise free up to 50GB, a 14-day cloud free trial, and Enterprise Premium with enterprise-grade support, SSO, and SLAs for large-scale, multi-region deployments. In summary, AI Observability by OpenObserve answers the question of how an agent run accumulated its cost, latency, and quality. It traces every agent, tool call, and model request with OpenTelemetry, evaluates live traffic, and correlates cost per token with the rest of production — one platform, deployable on your terms, priced per GB.
Brainloot is project management for game teams, built around Unity and Unreal Bridges so that a studio's team sees and updates the same tasks directly in the editor. It is aimed at people who make games: indie studios, solo developers, game jam participants, and student teams. The product is described as game-dev project management where web and phone stay on the same studio board, and where Discord intake is available when a team wants a player deck. Its stated purpose is to take a game from idea to release inside one workspace that covers the entire development cycle. Brainloot's core promise is focus. Its collectible-card boards run on the web with My Hand and Focus Mode, so that a developer works from a small active set rather than an overwhelming backlog. Game teams also lose work in a second, familiar way: player bug reports, feature requests, and short feedback notes arrive in a community Discord server, while the real work happens inside the Unity or Unreal editor. Brainloot's answer is to keep the same tasks in the editor, on the web, and on the phone, and to route Discord feedback into the board so it becomes tracked work instead of a message that scrolls away. Native bridges sit at the centre of Brainloot's game-development focus. The Unity Bridge ships with an editor dock and Scene pins, and Brainloot links cards to objects, actors, prefabs, and scripts so that a task can point at the exact thing in the project it refers to. Scene pins are highlighted as a way to pin tasks to GameObjects, keeping a bug or a to-do attached to the part of the scene where it belongs. The Unreal Bridge is described as coming in alpha, and Brainloot lists Unreal task management alongside its Unity task management. Teams using either engine get the same tasks in the editor rather than a separate tool they must leave the editor for. The board itself is organised with decks, cards, and custom views in a Kanban style, so a team can organise work its own way. Decks and custom lanes, together with card presets, let a studio shape the board around how it actually builds a game, while each card represents a piece of work such as a boss spawn, a nav-mesh bake, or a pin on a loot chest. My Hand is a personal task tray for deep work: a small active set of cards that the developer draws from, described on the site as three in play. Focus Mode supports the same idea of working from a limited, deliberate set of tasks. Milestones let a team plan toward shipping goals, and Reports show what is moving, what is stuck, and what the team shipped. Discord intake is the community-facing half of the product. Players log bugs in a Discord server and they land as cards on the board; testers request features into a deck that the team defines for that server; and short notes from the community are captured as loot cards. The result is a single intake deck where new reports show up on the studio board, driven by Discord /bug and /feature intake. Brainloot also supports public read-only board sharing, so a team can share a board with its community. On the client side, the mobile apps for iOS and Android carry the same board, the same Hand, and the same Focus Mode, and the site describes the web board as the system of record, with the live board keeping everything in sync. The overall approach is one studio board with several surfaces. The web board is the system of record, the Unity or Unreal editor dock shows the same tasks where the team builds, and the phone carries the same Hand and Focus Mode for work on the go. Brainloot describes the model as solo Hand first, guild seats when you need them: an individual starts with a small active hand of cards and draws again when those are done, while guild seats add shared decks, milestones, and permissions for a team. Because every surface reads from the same board, a card updated in the editor, in the browser, or on a phone is the same card everywhere rather than a copy. The benefit stated throughout the site is a smaller, clearer working set: instead of facing an overwhelming backlog, a developer pulls a few cards into My Hand and ships from one studio board. Teams keep planning and production in one place from idea to release, can plan milestones and track progress toward shipping goals, and can see in Reports what is moving, what is stuck, and what has shipped. Community feedback stops being lost because it arrives as tracked cards, and players and testers can follow progress through a public read-only board. Mobile access means the board is available away from the desk, and the Unity Bridge means the same tasks follow a developer into the editor. The site describes several concrete situations. A player finds a bug and reports it in the studio's Discord; the report lands as a card on the board. A tester asks for a feature in a deck the studio defined for that server, and the request becomes a tracked card. Short community notes are captured as loot cards so nothing is lost in the chat stream. Inside Unity, a developer pins a task to a GameObject, such as a boss spawn in a courtyard, a nav-mesh bake, or a loot chest, so the work is attached to the scene object. A solo developer opens My Hand, puts three cards in play, and works through them before drawing again. A studio plans milestones toward a release and checks Reports to see what shipped. And a team shares a public read-only board so its community can follow along. Brainloot is free to start with no credit card required, and it runs in the browser with Unity added after. Free covers Hand and Focus Mode, the web board, the Unity Bridge and Scene pins, Discord /bug and /feature intake, public board sharing, invites, seats and shared guilds, and custom lanes and card presets, with 2 workspaces, 5 decks, and 52 active cards; the Unreal Bridge is marked as soon. Pro is 9 GBP per month or 90 GBP per year with 10 workspaces, 250 decks, and 50k active cards. Team is 14 GBP per seat per month or 140 GBP per seat per year with 50 workspaces. A founder year offers Solo at 45 GBP and Team at 70 GBP per seat across 52 founding spots, first year annual, after which standard rates of 90 GBP Solo and 140 GBP Team seat apply. Integrations listed are Unity (early beta), Unreal (coming / alpha), Discord, web, and phone, with more tools coming soon. For game teams, Brainloot's value proposition is straightforward: one studio board, the same cards in the editor, on the web, and on the phone, Discord intake when a player deck is wanted, and a focus model that keeps the active set small. It is free to start, and it is built specifically for how game developers work.
The Frigade Assist API makes the AI agent you already built an expert in your product. With one tool call, your agent can answer product questions and guide users through workflows, right inside the agent you already built. Frigade presents it simply: you add Frigade in one call, and your agent answers questions and guides users through your product. The API is described as a lightweight SDK and two primitives — you register it as a tool your agent can call in a few lines, and your agent can then run a live product tour or return a grounded product answer. It is aimed at product and engineering teams who have built their own agents and want those agents to know the product. It is also available to teams with no agent yet, since Frigade ships a full in-product assistant that learns your product and guides users in real time, with no code required. The problem Frigade addresses is that most in-app AI agents answer "how do I do this?" with a wall of text, because they cannot see the screen. As Frigade puts it, your agent has read your docs but has never used your product. Written documentation is accurate exactly once; Frigade shows a help center article updated nine months ago, featuring a broken 404 screenshot, telling users to open "Webhooks (formerly Integrations)" and paste a URL. Answers like that go stale the day you ship. The Assist API closes that gap by giving your agent the same product your user is looking at, so it can walk them through the workflow instead of linking a document from two releases ago. Integration is deliberately small. The example in Frigade's documentation defines a single tool, frigade_guide_tool, with a description telling the agent to call it to answer product questions or guide the user through a task, and a query parameter describing what the user is asking or wants to do. The tool's run function calls frigade.assist({ query }), and you add that tool to your agent's existing toolset. It is framework-agnostic by design: it works cleanly with the Vercel AI SDK today, and any agent that can call a tool can call Frigade, regardless of how the agent was built or which models it runs. Your agent keeps its own reasoning and voice, decides when to call Frigade, and decides what to do with the result. Frigade learns your product by using it. It deploys agents that work through your real workflows the way your users do, documenting how each one behaves and taking in your existing knowledge base. The site describes this in three steps: you invite Frigade the way you would a user, with nothing to document or configure first; it works through real workflows, clicking the same paths your users click and mapping how features actually connect; and it re-learns on every release, so the map updates itself and your agent is never a version behind. A visual list of product areas — Security, Retention, Dashboards, Webhooks, Notifications, Environments, Provisioning, Custom fields, Imports, Integrations, Data export, and Members — shows items marked as relearned, moved, mapped, or unchanged after a September release. Guidance is one of the two primitives. Rather than returning text alone, Frigade draws a step-by-step guide right on the page. In an example settings screen, a Frigade panel shows "Step 1 / 3" and instructs the user to "Open Security to manage SSO. Follow the highlight," with the real steps rendered inside your own UI. In another example, while a user adds a webhook, the guide reads: "Add the URL and I'll send a test event to confirm it's live," with a step counter showing 4 of 6 and navigation controls. The Assist API also tells the agent what the user is looking at, which is what allows the guide to be placed in context. Answers are grounded and controlled by your team. Frigade generates answers from how your product works in the current release, so they hold up even when the help center is two releases behind. Your team stays in control: anyone can rate any answer and write the behavior they want instead — no code required — and the change holds from the next conversation onward. An example conversation shows an agent answering whether the Growth plan includes SSO, with a note underneath: "Also mention SAML is on Enterprise only," which is saved without code. Frigade calls this steering: the more your team puts in, the better it gets. Frigade logs every reply your agent gives. You can see every conversation your agent handled through Frigade in the dashboard, in Slack, or over the API. A list of example queries shows how calls resolve: "Does the Growth plan include SSO?" resolved, "How do I connect Slack?" guided, "Our contractor needs API access" guided, "I want to cancel my account" handoff, "Why did my sync fail last night?" guided, and "Delete our workspace and all data" handoff. Insights let you see where users get stuck, where the agent helps, and where it hands off. Frigade also knows its limits: when it cannot help it says so and passes the conversation to your team, returning fast so your agent never stalls or burns latency. Alongside answering and guiding, Frigade can proactively surface the right feature to a user when they would benefit from it — the same idea as Frigade's Suggestions product — helping drive feature adoption and expansion revenue. Underneath the tool call, Frigade describes an entire engine that relearns your product, plus a platform your team manages with no code. Four components are named: the product model, built by using your product and rebuilt every release; grounded answers, written from your actual product rather than just your docs; guidance, the real steps rendered inside your own UI; and steering, where the more your team puts in, the better it gets. The company frames the difference bluntly: it is not just a tool call. The benefits are described throughout. Your agent stops linking stale documents and starts walking users through the workflow. Answers stay current because Frigade relearns on every release, so you do not have to retrain the agent or rewrite prompts. Support, CS, and CX teams own the answers without filing tickets to engineering. Every answer is logged, giving your team visibility in the dashboard or over the API. The agent stays in control of the conversation — Frigade adds product expertise, it never takes over. And when Frigade cannot help, it hands off cleanly. A customer story from Valley reports that Frigade solved over 400 queries a month that would otherwise have gone to support, equivalent to two hires the company did not have to make, paying for itself within the first two months. Typical scenarios appear directly in Frigade's content. A user asks whether the Growth plan includes SSO and gets a grounded answer about turning it on under Settings, then Security. A user needs to add a webhook: the agent starts a guided flow in the app, the user pastes an endpoint URL, and the guide confirms it will send a test event. A user asks how to set up SAML, connect Slack, or grant API access to a contractor, and the agent guides them. A user asks to cancel an account or delete a workspace and all data, and Frigade hands the conversation to the human team. A user asks why a sync failed or why a webhook stopped firing and gets guided help. Morning Consult reported a working prototype deployed in less than a few hours of automated training, able to generate product tours on the fly without manual configuration. Frigade Assist API is used by product and engineering teams who want the agents they built to gain real expertise in their product. Frigade says it is trusted by teams building the best products, naming Sanity, Arc, Merge, Productboard, Legora, Retell, Logicbroker, Hotplate, Spellbook, Perfect Venue, Simplify, and Typewise, and quotes Vercel CEO Guillermo Rauch calling Frigade "mind-blowingly good." On integration, the Vercel AI SDK is supported and the API stays framework-agnostic. On security, Frigade is SOC 2 Type II certified and fully GDPR compliant, with data encrypted in transit with TLS 1.2+ and at rest with AES-256, EU data residency, a zero-retention LLM policy, and automatic PII scrubbing. Guidance runs with the user's own permissions, so the agent only sees what the user can already see, and teams needing full data control can self-host Frigade with their own LLM keys. Pricing starts at $1,000 per month with usage-based scaling, and enterprise plans with custom pricing are available. For teams that have built their own agents, the Frigade Assist API is one tool call that turns those agents into product experts — grounded in the live product, able to draw step-by-step guidance inside your own UI, tunable by your team without code, and able to hand off cleanly when it cannot help. Frigade's own summary puts it simply: give your agent product superpowers.
GoModel is an open-source AI gateway written in Go and released under the MIT license. It places a single OpenAI- and Anthropic-compatible endpoint in front of 31 AI model providers, so applications keep the request shape they already use while the gateway handles authentication, workflow resolution, provider routing, caching, budgets, guardrails, failover, audit logging, and usage tracking behind that endpoint. It is built for engineering teams, platform teams, and developers who want the provider-switching and governance logic that would otherwise leak into application code to live in one self-hosted layer instead. GoModel ships as one small binary with an embedded admin dashboard, so there is nothing else to deploy. The gateway exists to solve a specific set of problems that appear once AI workloads reach production. Without a gateway layer, provider switching, debugging, and usage tracking start leaking into application code, and teams that integrate a provider directly find that switching vendors becomes a code project rather than a configuration change. A single behavior rarely fits every team or every app: one path may need cache, another audit logging, another guardrails. Identical prompts can be paid for twice when duplicate requests are dispatched. Provider dashboards show one aggregate total, which makes it hard to attribute spend to teams, tenants, and features. When a fallback fires during an incident, nobody can reconstruct why it happened. And running a gateway can become its own scaling project if the software sitting on every request is heavy to operate. GoModel moves that logic into one gateway layer so that provider choice is decoupled from the application. GoModel's routing and provider layer covers a broad range of models behind a single endpoint. OpenAI, Anthropic, Gemini, Bedrock, Vertex, Azure, Groq, Ollama, vLLM, and more are supported, with round-robin rotation across multiple keys per provider, and suffixed environment variables that register extra instances of the same provider type. Aliases and virtual models let teams publish stable names such as smart-chat and remap the real provider and model behind them, which is a config change rather than an application change. Load balancing spreads a virtual model across targets with weighted round-robin, or lets cost-based routing pick the cheapest capable model for each request. Automatic failover sends availability errors to the next model or provider, with retries using backoff and a circuit breaker absorbing flaky upstreams. Provider passthrough lets you call any provider's native API through /p/:provider/* while keeping GoModel's auth, usage tracking, and audit on the way through. Control and safety features are configured through scoped workflows. A workflow toggles cache, audit, usage, budgets, guardrails, and failover per provider, model, or user path, and the most specific matching scope wins; workflow versions are immutable so you can see exactly which policy a given request ran under. Guardrails can inject system prompts or rewrite messages with an LLM before dispatch, running as ordered steps that execute in parallel groups. Virtual API keys hand teams managed keys bound to a user path and labels instead of raw provider credentials, and those keys can be revoked and rotated from the admin UI. Rate limits cap request rate and concurrency per user path, provider, or model, and saturated routes are routed around when alternatives exist, returning 429 with Retry-After when they do not. On the cost side, budgets enforce hard spend limits per user path or label, evaluated from tracked usage cost and enforced before a request is dispatched, so the run stops at the cap rather than at the invoice. Response caching works in two ways: exact-match caching returns identical non-streaming requests straight from the gateway with no provider call and no cost, while semantic caching matches similar prompts and is backed by Qdrant, pgvector, Pinecone, or Weaviate. Usage and cost tracking records token and dollar accounting per request, user path, and label, with per-model pricing overrides for when list prices do not match your contract. Cache lookups run after alias and workflow resolution, so policy decisions still apply, and cache hits are visible in the dashboard. Observability and surface area extend well beyond chat completions. Audit logs capture every request with its resolved route, workflow, cache result, and provider attempts, with bodies and headers logged only when explicitly enabled. The embedded admin dashboard shows live request logs, usage breakdowns, keys, budgets, workflows, and provider status without a separate deployment. Request tagging flows labels from headers or key metadata into usage and audit, so spend and incidents map to teams, tenants, and features. Prometheus /metrics exposes request, provider, and circuit-breaker gauges alongside health endpoints and optional pprof profiling, and OpenTelemetry traces and metrics cover every inbound request and provider call on the GenAI semantic conventions, readable by Jaeger, Tempo, Honeycomb, or Datadog as they are. GoModel also serves the full OpenAI surface including chat, embeddings, the Responses API with gateway-managed conversations, files, and batches, plus the Anthropic Messages API with native /v1/messages and token counting, audio and realtime features such as text-to-speech, transcription, and realtime speech over WebSocket and WebRTC, an MCP gateway that aggregates MCP servers behind one endpoint with namespaced tools, and a built-in playground for sending a real request against any model or alias. Overall, GoModel authenticates each request, applies the matching workflow with its guardrails, cache, budgets, and rate limits, and routes it to the right provider with automatic failover, all behind OpenAI- and Anthropic-compatible APIs. Every response records usage and cost, writes an audit trail, and updates the live dashboard, while cache hits return instantly without a provider call. Because the gateway runs as one Go binary with Docker, Compose, and Helm recipes and the admin UI is embedded, deployment is minimal. Storage starts on SQLite with zero setup and moves to PostgreSQL or MongoDB when traffic and retention demand it, using the same binary with a different config. Session keeping makes requests from one conversation or agent task stick to the target and key that served the first, which keeps provider prompt caches warm, audit logs threaded, and cost attributable per session, with zero configuration required. The benefits follow from that architecture. Teams get one stable API that decouples provider choice from the application, so models can be swapped with a config change. Duplicate prompts stop paying full price twice because caching returns them faster and cheaper. Spend becomes attributable per team, tenant, model, and label instead of appearing as a single provider total. Incidents become reconstructable: a fallback that fired can be traced through audit logs and runtime metadata showing the resolved route and provider attempts. Compliance reviews can replay any request, including guardrail versions and full bodies where logging is explicitly enabled. And the gateway itself stays lightweight: a single binary with storage that grows with the workload, so the gateway does not out-scale the application it serves. Concrete workflows show how it is used. A multi-tenant SaaS issues a virtual key per customer, tracks usage by user path, and enforces per-tenant budgets so invoices come from the dashboard rather than guesswork. A platform team publishes aliases like smart-chat with scoped workflows behind them, letting product teams ship features without ever holding provider keys. Production traffic rides failover chains with retries and circuit breakers, turning a provider incident into a routing event instead of a customer-facing one. Caching absorbs duplicate prompts, cost-based routing picks the cheapest capable model, and budgets stop end-of-month surprises without code changes. Compliance reviews replay any request with its resolved route, guardrail versions, provider attempts, and full bodies where logging is explicitly enabled. Developers run Ollama or vLLM locally behind the same endpoint the cloud providers serve in production, so moving from laptop to production is config, not code. GoModel supports 31 providers, including OpenAI, Anthropic, Google Gemini and Vertex AI, Azure OpenAI, Amazon Bedrock, OpenRouter, Cohere, Groq, xAI, DeepSeek, Fireworks AI, Alibaba Bailian, MiniMax, Z.ai, ElevenLabs, Ollama, vLLM, and any OpenAI-compatible backend registered as its own instance. Hundreds of models are read from live provider catalogs, and connection is typically a single environment variable. Deployment options include a one-command binary install for macOS, Linux, and Windows, a compressed 14.4 MB Docker image, Docker Compose, and Kubernetes with a Helm chart. The gateway is MIT licensed, and GoModel Pro is a commercial distribution that adds prompt compression, OIDC single sign-on, per-child quota templates, and intelligent routing for $4,999 per year or $499 per month, flat per company, with a 30-day money-back guarantee and an offline signed license token. A roadmap toward v0.2.0 tracks remaining work such as plugins starting with guardrails, guardrails hardening with custom and response-side guardrails, passthrough for every provider, and failover and streaming for image endpoints. In short, GoModel is an open-source AI gateway that collapses provider routing, governance, cost control, and observability into a single small binary with one OpenAI- and Anthropic-compatible endpoint, giving teams a self-hosted alternative to OpenRouter and LiteLLM without running a Python service on the hot path.
49Agents IDE is a 2D integrated development environment for running and managing AI coding agents across teams, projects and machines. The product's own description calls it "an infinite 2D canvas where every AI coding agent, terminal, repo and machine you own lives side by side." Instead of stacking terminal tabs, users build their own map of work, placing every terminal, note, file, Git graph, web page and directory anywhere on one infinite, zoomable plane. The site positions it as "one infinite canvas instead of a stack of terminal tabs," aimed at developers who run many agents and processes at once — described on the page as "10x Engineers" — and at teams that need to keep agents, projects and machines visible in one place. It is open source and self-hostable, with an optional hosted app. The problem 49Agents IDE addresses is tab navigation fatigue. When a developer runs several AI coding agents, terminals and repositories at the same time, those processes end up buried in a long stack of tabs, and context is lost. Product Hunt metadata describes the tool as a "2D IDE for running agents across projects without fatigue" and explains that it "leverages how our brains are wired to solve tab navigation fatigue problem for 10x Engineers." Because the interface is described as citybuilder-like, the product's own framing is that "it becomes effortless to associate processes to tabs, even when you come back to them days later." That matters for anyone juggling parallel agent runs, multiple repos and remote machines, where re-establishing context after an interruption is otherwise slow and error-prone. The core surface is the canvas. The site describes "one infinite, zoomable plane" on which every terminal, repo and agent you run lives. Panes can be placed wherever the user chooses — the interactive tour lists pane types including Terminal, Note, File, Git Graph, Web Page and Directory. Because the plane zooms and pans without limit, users can arrange panes spatially rather than stacking them, which is what makes the layout memorable. The canvas also communicates agent state visually: "Panes glow blue while Claude is working and pulse vermillion the moment it needs your permission." That means a user can see at a glance, even from a zoomed-out view, which agents are busy and which are waiting on an approval, without opening each one individually. 49Agents IDE is also built around machines rather than a single host. The site's section on machines is titled "Your laptop, your desktop, your cloud box," and it explains that you can "connect the machines you own and open terminals on them directly from the canvas, with a live CPU and RAM HUD for each one." The page shows an example workspace containing a PC at home, an AWS server and a MacBook Air, each annotated with counts. The site also refers to "your remote dev machines, one canvas away." Practically, this means terminals from several computers appear as panes on the same plane, each with its own CPU and RAM readout, so a developer does not have to switch between separate terminal clients or SSH sessions to keep an eye on several boxes. Setup is designed to be fast and to require no account. The site offers two paths. The first is to have an agent do it: users are given a prompt instructing the agent to "check how to install and setup 49agents IDE on this machine - grab the repo from github, set it all up, download dependencies, and give me localhost link" and confirm it works. The second is manual: clone the repository from GitHub with git clone https://github.com/49Agents/49Agents.git, then run ./49ctl setup followed by ./49ctl start. The app then opens at http://localhost:1071 with "No account, no login, no token." Requirements are stated as Node ≥18, tmux and ttyd. The section is headed "Self-host in minutes," and for those who prefer not to self-host, a hosted app is available at app.49agents.com. The product's distinguishing idea is spatial, citybuilder-like organization instead of a tab bar. The map is one "that you build yourself," so the layout reflects the user's own mental model of their projects, agents and machines rather than an order imposed by an application. 49Agents' own explanation is that this "leverages how our brains are wired" to reduce tab navigation fatigue and to make it "effortless to associate processes to tabs, even when you come back to them days later." The visual status system — blue for working, vermillion for permission requests — extends that spatial approach to state as well as location, and the multi-machine support means the same spatial model covers remote hardware as well as local processes. The stated benefits follow from those design choices. Users see all of their agents on a single canvas rather than hunting through tabs; the site's first canvas section is headed "See all your agents on a single canvas." Because the plane is infinite and zoomable, it can hold as much work as the user chooses to place on it. Status colors and per-machine CPU and RAM readouts give a passive overview of what is running and what needs attention. And because the software is open source and self-hostable, with no account, login or token required when run locally, individuals and small teams can operate it on their own machines under a free individual tier. Concrete scenarios described in the content include a developer running several AI coding agents in parallel and needing to spot which one is waiting for permission — the vermillion pulse addresses exactly that. Another is managing several owned machines at once: the site's example shows a home PC, an AWS server and a MacBook Air connected on the same canvas, with terminals opened on each directly from the canvas and a live CPU and RAM HUD per machine. A third is returning to work after a break: the site claims the citybuilder-like UX makes it effortless to associate processes to tabs "even when you come back to them days later." Teams are covered as well: the company plan lists shared canvases and coworking mode, and the page's headline frames the product as a 2D IDE for managing agents across teams, projects and machines. 49Agents IDE is aimed at developers who run multiple agents, terminals and repositories — the site's phrasing is "10x Engineers" — and at teams managing agents across projects and machines. The license is BSL 1.1, described as "free for individuals and small teams." There are two published plans. Individual is $0 and includes self-hosting on your own machines plus issues and discussion on GitHub. Company is "Talk to us" and includes shared canvases, coworking mode, hosting on your own infrastructure and direct support from the team, with contact by email at alp@49agents.com. Hosting options are self-hosted (localhost:1071, no account, no login, no token) or the hosted app at app.49agents.com. Running locally requires Node ≥18, tmux and ttyd. The project is open source, with the repository at github.com/49Agents/49Agents. In short, 49Agents IDE replaces the stack of terminal tabs with one infinite 2D canvas where every agent, terminal, repo and machine lives side by side. It combines spatial, citybuilder-like organization, at-a-glance agent status colors, multi-machine terminals with CPU and RAM readouts, and open-source, self-hostable deployment to address tab navigation fatigue and lost context. For developers and teams who run many agents at once, it is one infinite canvas for every agent, project and machine you run.
Harden's Agentic Integrity Foundation (AIF) is a free, local security tool for AI coding agents. It runs on your own device, judges every action a coding agent is about to take, and stops the dangerous ones before they execute. The product installs with a single local command — curl -fsSL https://aif.harden.run/install.sh | sh followed by aif configure — and needs no account to get started. Supported tool calls are checked locally before they run, so the agent's request and session context are evaluated on your machine rather than in the cloud. Harden describes itself as an AI safety products company building guardrails for the dark software factory, and AIF is its coding-agent endpoint security product, aimed at individual developers who use coding agents and at organizations that later need shared controls and enterprise deployment. Coding agents can reach the same systems developers can. MCP gateways can hide raw credentials, but they do not block tool access. Sandboxing protects the local machine, but it cannot stop an agent from managing a database or a VM. Harden also argues that base models, just like developers, are incentivized to solve tasks in the minimum possible time and cost, so they end up taking shortcuts or executing bad actions even when they have been told to follow laws and rules. The site points to the myriad cybersecurity breaches reported by frontier labs and press reports about Openclaw and Hermes as evidence of this risk. Harden's stated position is that, just as traditional cybersecurity operates separately from product development due to conflicting incentives, autonomous agent security and control will evolve outside of the frontier LLM providers. Analyzing every supported tool call before it executes is the gap AIF is built to fill. Harden can allow an action, ask for approval, make it safe, block it, or record it. In the protection activity view these outcomes appear as Block, Ask, Redact (made safe), Allow, and Log only. In the published example activity, 34,222 tool calls were checked before execution across 7 sessions: AIF allowed 33,382 calls, logged 256, and changed or stopped 584, with 415 blocked for review, 169 made safe for inspection, and 33,382 allowed to proceed. The monitor is built as a block-and-steer system, meaning that when a dangerous command is stopped Harden can offer a safe retry. In the example on the site, a routine command — kubectl rollout status deployment/payments-api -n production — was allowed and recorded locally, while kubectl delete namespace production was blocked with the message "production is protected", followed by a safe retry: kubectl rollout restart deployment/payments-api -n staging. Harden works with the agents you already use. One local setup finds supported coding agents on your machine and checks their tool calls before they act, using native hooks for supported coding agents and an MCP proxy fallback for other tools, with a local decision history kept on your device. The currently listed agents are Claude Code, Codex, Antigravity CLI, Cursor, Kiro, Hermes, and OpenClaw. The activity table on the site shows each of these connected to a different project workspace — harden-platform, agent-workspace, payments-agent, web-client, service-api, harden-docs, and release-tools — each with its own set of checked, blocked, made-safe and logged calls. Version details are published too: Claude Code 2.1.241, Codex 0.146.1, Antigravity CLI Latest CLI, Cursor 2026.08.11-e8db854, Kiro 2.19.1, Hermes 0.19.0, and OpenClaw 2026.7.1-2, with compatibility rechecked on every AIF or supported-agent release. Harden is presented as a local monitor tested against frontier models. It is evaluated as a pre-execution monitor across four agent-security benchmarks and reports beating the GPT monitor baseline on each: SLEIGHT at 15.8% versus 14.3%, AgentHazard at 83.7% versus 81.4%, SABER at 48% versus 44.7%, and LinuxArena at 29% versus 34% where lower is better. The stated baselines are GPT-5.5 for SLEIGHT, AgentHazard and SABER, and GPT-5 Nano for LinuxArena, with benchmark-specific measures detailed in the research. The underlying models are proprietary: Harden's custom cybersecurity models run on your devices, and per the FAQ, proprietary cybersecurity-focused LLMs run locally and privately on every developer's laptop alongside a proprietary code-analysis algorithm for feedback-driven placement of dynamic inline reference monitors. Because processing is local, the repo and tool output can stay on the machine. Overall, AIF is a local pre-execution monitor. It installs with one command, is configured with aif configure, and then connects to the coding agents the developer already uses. From that point on, supported tool calls are intercepted — through native hooks where available and through an MCP proxy fallback for other tools — and checked before they execute, using the request and session context. The decision is made on the local machine by a post-trained model, and the outcome is recorded in a local decision store with an audit view and no retention cap. Harden's stated core proprietary IP combines those cybersecurity-focused LLMs with a code-analysis algorithm for feedback-driven placement of dynamic inline reference monitors, which determines where monitoring is applied within the agent's workflow. Users gain protection without changing their agent workflow: run one local setup, and the agents already in use are discovered and checked. The free tier covers core pre-execution secret-flow blocking on the machine forever, block-and-steer with safe retry, a local decision store and audit view with no retention cap, no account required, and telemetry opt-out. Keeping decisions local means the repository and tool output do not need to leave the device, which matters for teams working with sensitive code. Logos and memberships shown on the site include Randstad, CALDIC, Relfast Solutions, the Coalition for Secure AI, and the Financial Institution Insurance Council. Harden states that AIF beat frontier models on key agent-security benchmarks while keeping the repo and tool output on the machine. Concrete scenarios appear directly in the content. An agent working in ~/payments-api runs kubectl rollout status deployment/payments-api -n production; Harden allows it and records it locally. The same agent then attempts kubectl delete namespace production; Harden blocks it because production is protected and offers a safe retry that restarts the deployment in staging instead. Across connected agents, sessions such as harden-platform with Codex, agent-workspace with Claude Code, or release-tools with OpenClaw accumulate thousands of checked calls, with blocked and made-safe actions routed for review or inspection. Organizations that need more than individual protection can add shared controls and enterprise deployment, including compliance reporting, air-gap / zero-telemetry mode, managed installation via MDM, support SLAs, and custom terms. Developers who want the evidence behind the tool can read the AIF blog or watch the YouTube playlist. AIF is described as free for individual developers and supported on macOS and Linux; the free tier requires no account and no credit card. System requirements are published: a full local model needs macOS with Apple Silicon and Metal, the CLI and daemon run on macOS or Linux x86_64, 16 GB of memory is the minimum with 24 GB recommended, 15 GB of free disk is required for install, updates and rollback, and Windows is not supported yet. Getting started means installing the free product, running aif configure, and connecting the coding agents you use, with a call available for help. On pricing, Harden says protection starts free on your machine and that you add shared controls and enterprise deployment when your organization needs them. The free tier works with Claude Code, Codex, Cursor, Antigravity CLI and Kiro, while the enterprise tier adds compliance reporting, air-gap / zero-telemetry mode, managed installation via MDM, support SLAs, and custom terms. The company is built by AI researchers and security operators, with team background spanning Google DeepMind, MILA, WhatsApp, Zscaler, Oracle, Microsoft, Amazon, CrowdStrike, and Sony. The takeaway Harden puts forward is simple: let the agents run, but control what they do. By checking supported coding-agent tool calls locally before execution and blocking or making safe the dangerous ones, AIF gives developers a free, private guardrail that sits alongside the agents they already use — with optional shared controls and enterprise deployment when an organization needs them.
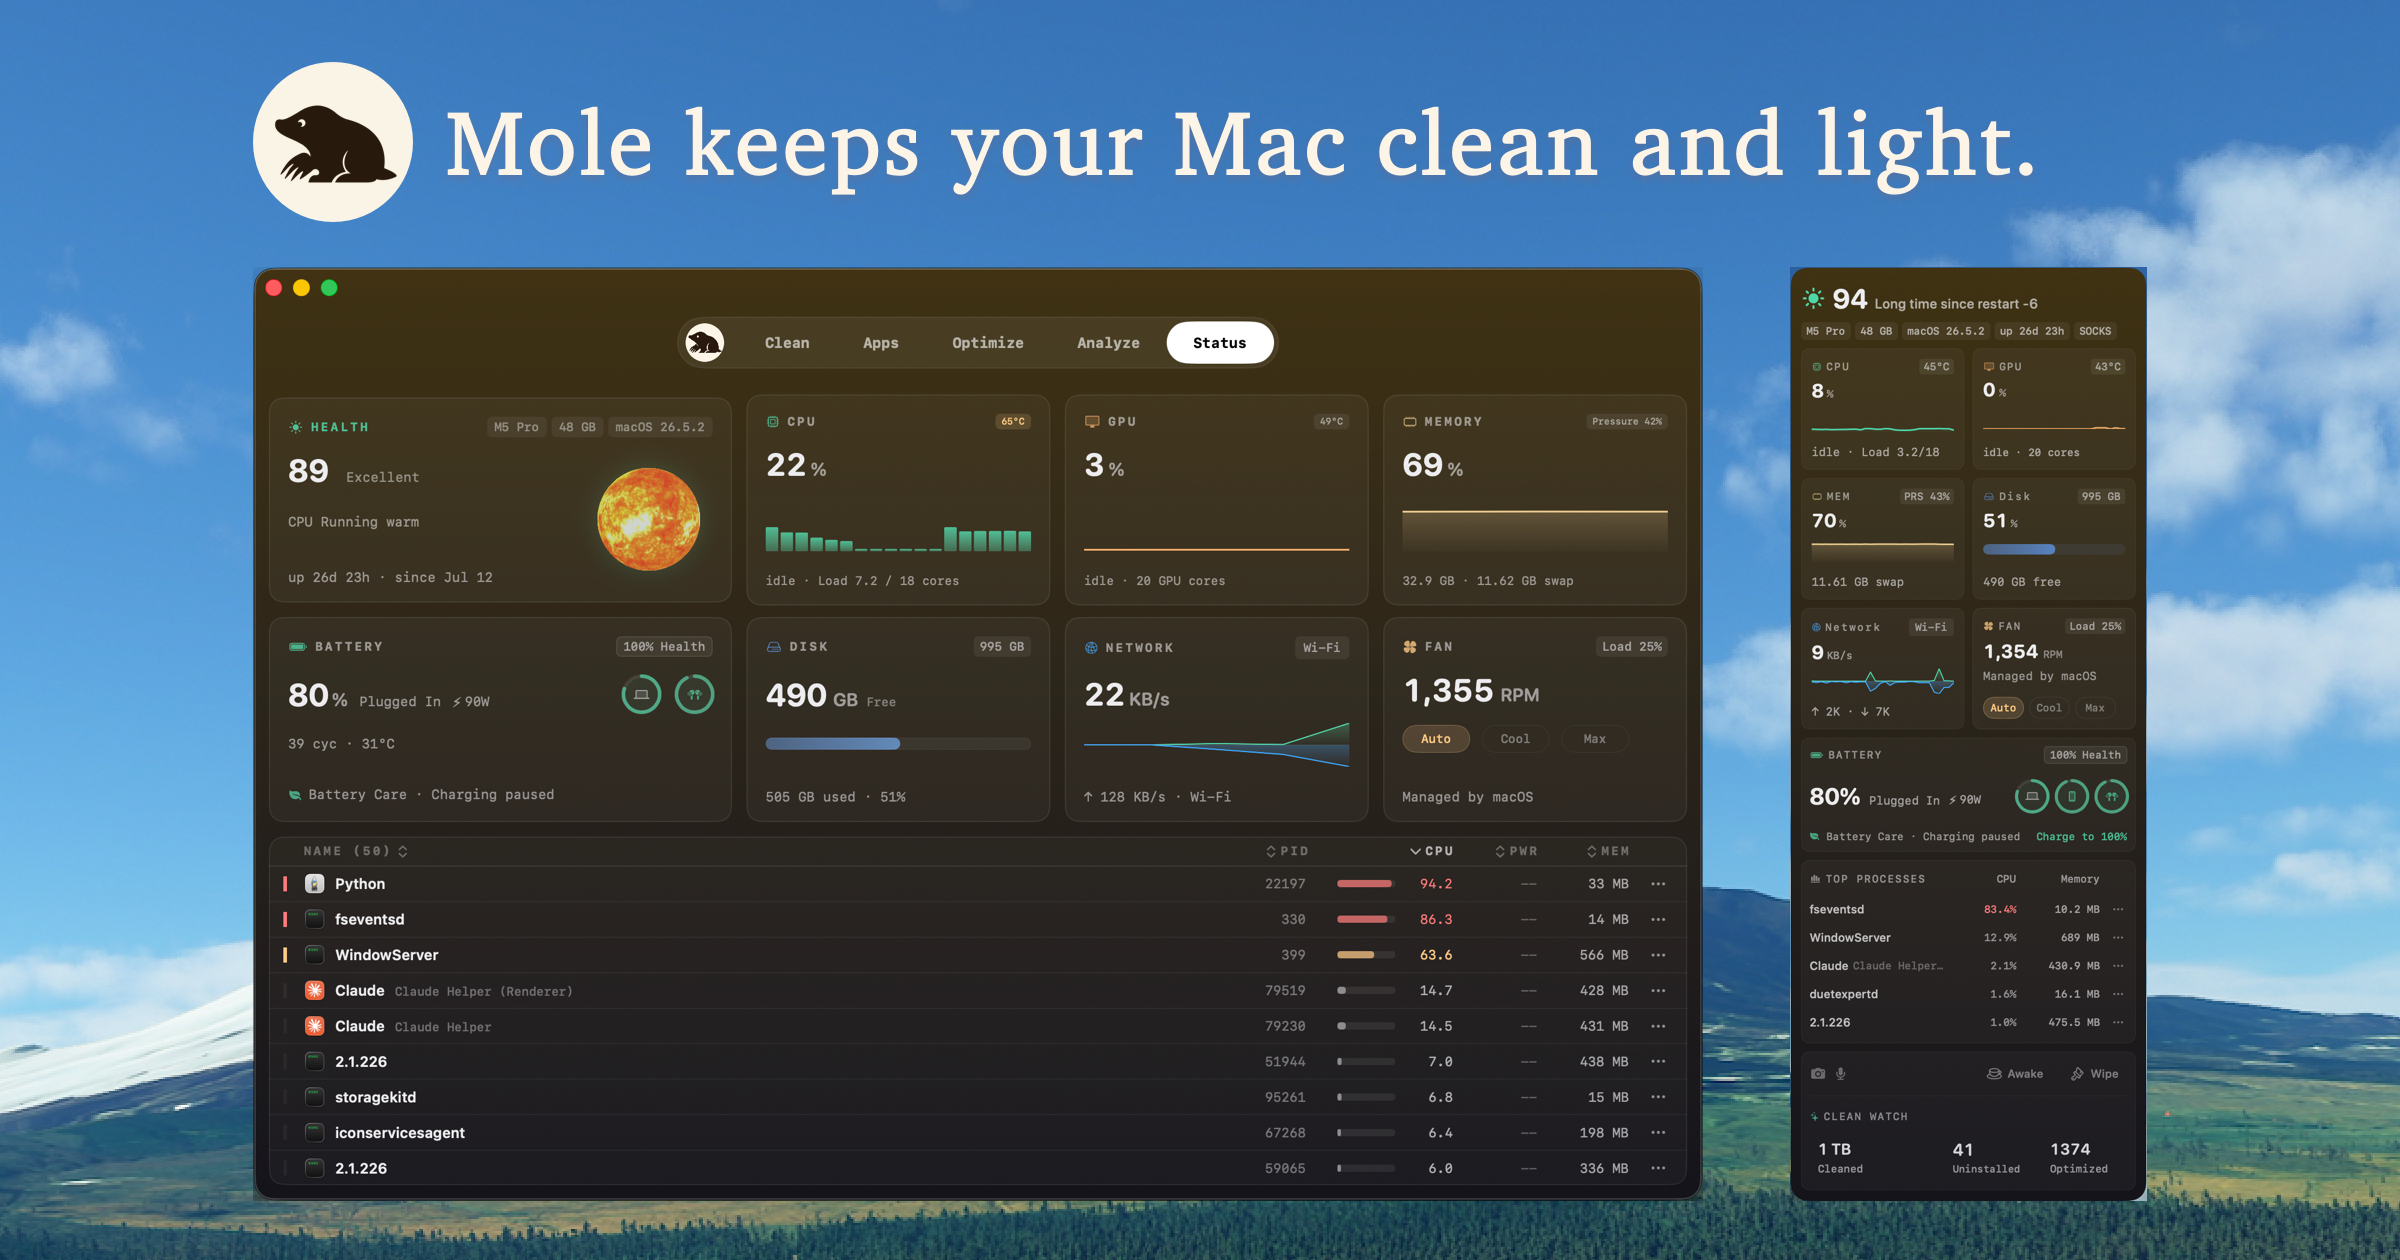
Mole is a native Mac app that combines five tools in one: Clean, Software, Optimize, Analyze, and Status, plus a menu bar HUD, privacy alerts, Battery Care, fan control, Keep Screen On, and Clean Screen. It is designed for Mac users, developers, and power users who want a single utility for cleaning caches, managing apps, maintaining the system, analyzing disk space, and checking live system metrics. The app is presented through a planet-themed interface where each planet has one job and says up front what it checks and what it may change. Macs accumulate caches, app leftovers, temporary files, and other junk over time, which can slow down the system and fill up expensive storage. Many users rely on multiple separate tools such as CleanMyMac, AppCleaner, DaisyDisk, and iStat Menus to handle different maintenance tasks. Mole addresses this by consolidating these capabilities into one native app while emphasizing transparency: it previews paths and sizes before cleanup, keeps scans local, and moves recoverable removals to Trash. This approach gives users confidence about what will change on their system before anything is removed. The Clean tool, represented by Earth, offers ten cleanup categories with safer regenerable caches listed first. Users can review every item and then select, skip, or protect it before cleaning. Caches can be deleted directly or sent to Trash for extra safety. Scans and cleanup stay entirely on the Mac, and files and results are never uploaded, which addresses privacy concerns that users may have with cloud-connected cleaners. The Software tool, represented by Mars, helps manage applications. It checks for updates from Sparkle, App Store, Homebrew, and other supported sources. Users can uninstall apps and review related leftovers together, manage supported login and background items on the same page, and see app and leftover sizes before removing anything. This makes it easy to keep software up to date, remove unwanted apps completely, and control what launches at startup. The Optimize tool, represented by Mercury, maintains system components such as Quick Look, caches, metadata, and common macOS services in one run. Admin tasks share a single authorization instead of prompting one by one. Tasks that are unsafe or not applicable are skipped with a reason, and the result shows what ran and why anything was skipped. This gives users a clear, low-risk way to perform routine macOS maintenance. The Analyze tool, represented by Jupiter, provides a whole-disk treemap that makes the largest files and folders easy to spot. Users can drill into any folder and jump back from the path bar. Items can be opened in Finder or moved to Trash from the context menu. System folders stay view-only, and moving anything to Trash always asks for confirmation, protecting important system data from accidental deletion. The Status tool, represented by the Sun, offers live CPU, memory, GPU, disk, network, temperature, and fan metrics. It shows battery status for the Mac, paired iPhone or iPad, and Bluetooth accessories. Users can sort or pin processes and open a plain-language explanation for each one. The metrics users choose can be placed in the menu bar HUD, which also displays a runner animation, live metrics, privacy activity, Keep Screen On, hardware tiles, and top processes. Mole's unique approach is built around the idea of five planets, each keeping to one small job and stating up front what it checks and what it may change. Before cleaning, Mole shows paths and sizes so users know exactly what will be removed. Recoverable removals are moved to Trash, and scans remain local. The app also has a companion open-source CLI, with commands such as `brew install tw93/tap/mole` and `mo clean`, which is popular among developers and terminal users. Users have reported significant benefits, including freeing 15 GB, 23 GB, 40 GB, 50 GB, 100 GB, 142.97 GB, and even 200 GB of space. Many say Mole replaced CleanMyMac, AppCleaner, DaisyDisk, and iStat Menus, and that it found items other cleaners missed. The UI has been praised for being beautiful, fast, and easy to use, while the CLI is appreciated by developers who prefer the terminal. Concrete use cases from the content include cleaning developer build caches such as Xcode derived data, refreshing older Macs that feel slow, freeing space on Macs with small or expensive storage, uninstalling apps along with hidden leftovers, managing startup and background items, monitoring system health and battery status, and checking live CPU, memory, GPU, disk, network, temperature, and fan metrics. The menu bar HUD is useful for quick glances at system status without opening the main app. Mole targets developers and power users who use macOS and often work in the terminal, as well as everyday Mac users who want a simpler way to maintain their computer. The open-source CLI is free and can be installed with Homebrew, while the Mac app is a paid product described as pay once with lifetime updates. Some users mentioned a 14-day refund guarantee and a license covering two Macs. The app integrates with Sparkle, App Store, and Homebrew for update checks, and it manages login and background items. Overall, Mole's value proposition is a transparent, native Mac maintenance app that shows before it cleans, keeps scans local, and safely moves recoverable items to Trash. By combining cleanup, software management, optimization, disk analysis, and live status monitoring into one polished app, it offers a practical alternative to multiple separate utilities for keeping a Mac fast, clean, and healthy.
Skilldocs is a collaborative markdown editing tool described as "Figma for markdown." It allows users to open a skill document and have everyone inside it at once, with real cursors, inline comments, and an editor that renders as you type. Once the group has finished editing and discussing the document, the whole conversation and diff can be handed back to a coding agent. The product is aimed at teams and developers who work with markdown files and need a better way to collaborate than pasting documents into other apps or sharing screens. Collaborating on .md files is often painful. People paste them into Notion, open them locally and share their screens, or edit in separate tools without real-time awareness. After making edits and comments, there is no easy way to get the feedback back into coding agents. Skilldocs solves this awkward collaboration gap by providing a shared live workspace for markdown documents, so multiple people can work in the same file simultaneously and then export the results for agent use. Skilldocs combines features from several popular products: HackMD's mono viewer, Figma's live cursors and follow mode, Google Docs' real-time highlighting and comments, and Bear's beautiful WYSIWYG markdown editor. During a session, users can edit the doc together, leave inline comments, and see each other's cursors in real time. Afterward, they can copy the diff and comments and send them to their coding agent of choice. The product supports several ways to import skills: dropping a .md file, pasting markdown, importing from GitHub, or importing from a local machine via an MCP. Export is also simple: users can copy the .md of the current doc, the diff, or the comments. This flexibility makes it easy to bring existing markdown content into Skilldocs and then move the results back out. One notable feature is the ability to click on a teammate's avatar to follow them through a doc or even through switching docs. This works like following in Figma, feeling like a screenshare but snappier. Another feature is the ability to cmd+click to create multiple carets and edit several lines at once, a capability borrowed from Sublime. Skilldocs is positioned for collaborative document work in general. The maker notes that it's really fun having a meeting in it, indicating that the product can be used as a live collaborative space during meetings. The ability to hand the conversation and diff back to an agent also opens up workflows where coding agents can pick up context directly from the collaborative session. The product is launched as free, with a focus on productivity, developer tools, and artificial intelligence. The maker is Rajiv Ayyangar, and the product is built with Cloudflare, Vercel, and Claude Code. The team is considering adding proper team source control, as it has been requested by users, and is open to suggestions. Skilldocs addresses a real need for teams that work with markdown skills or docs and need both human collaboration and agent handoff. Its combination of real-time editing, live cursors, inline comments, and easy export to coding agents makes it a practical tool for modern collaborative development and documentation workflows.