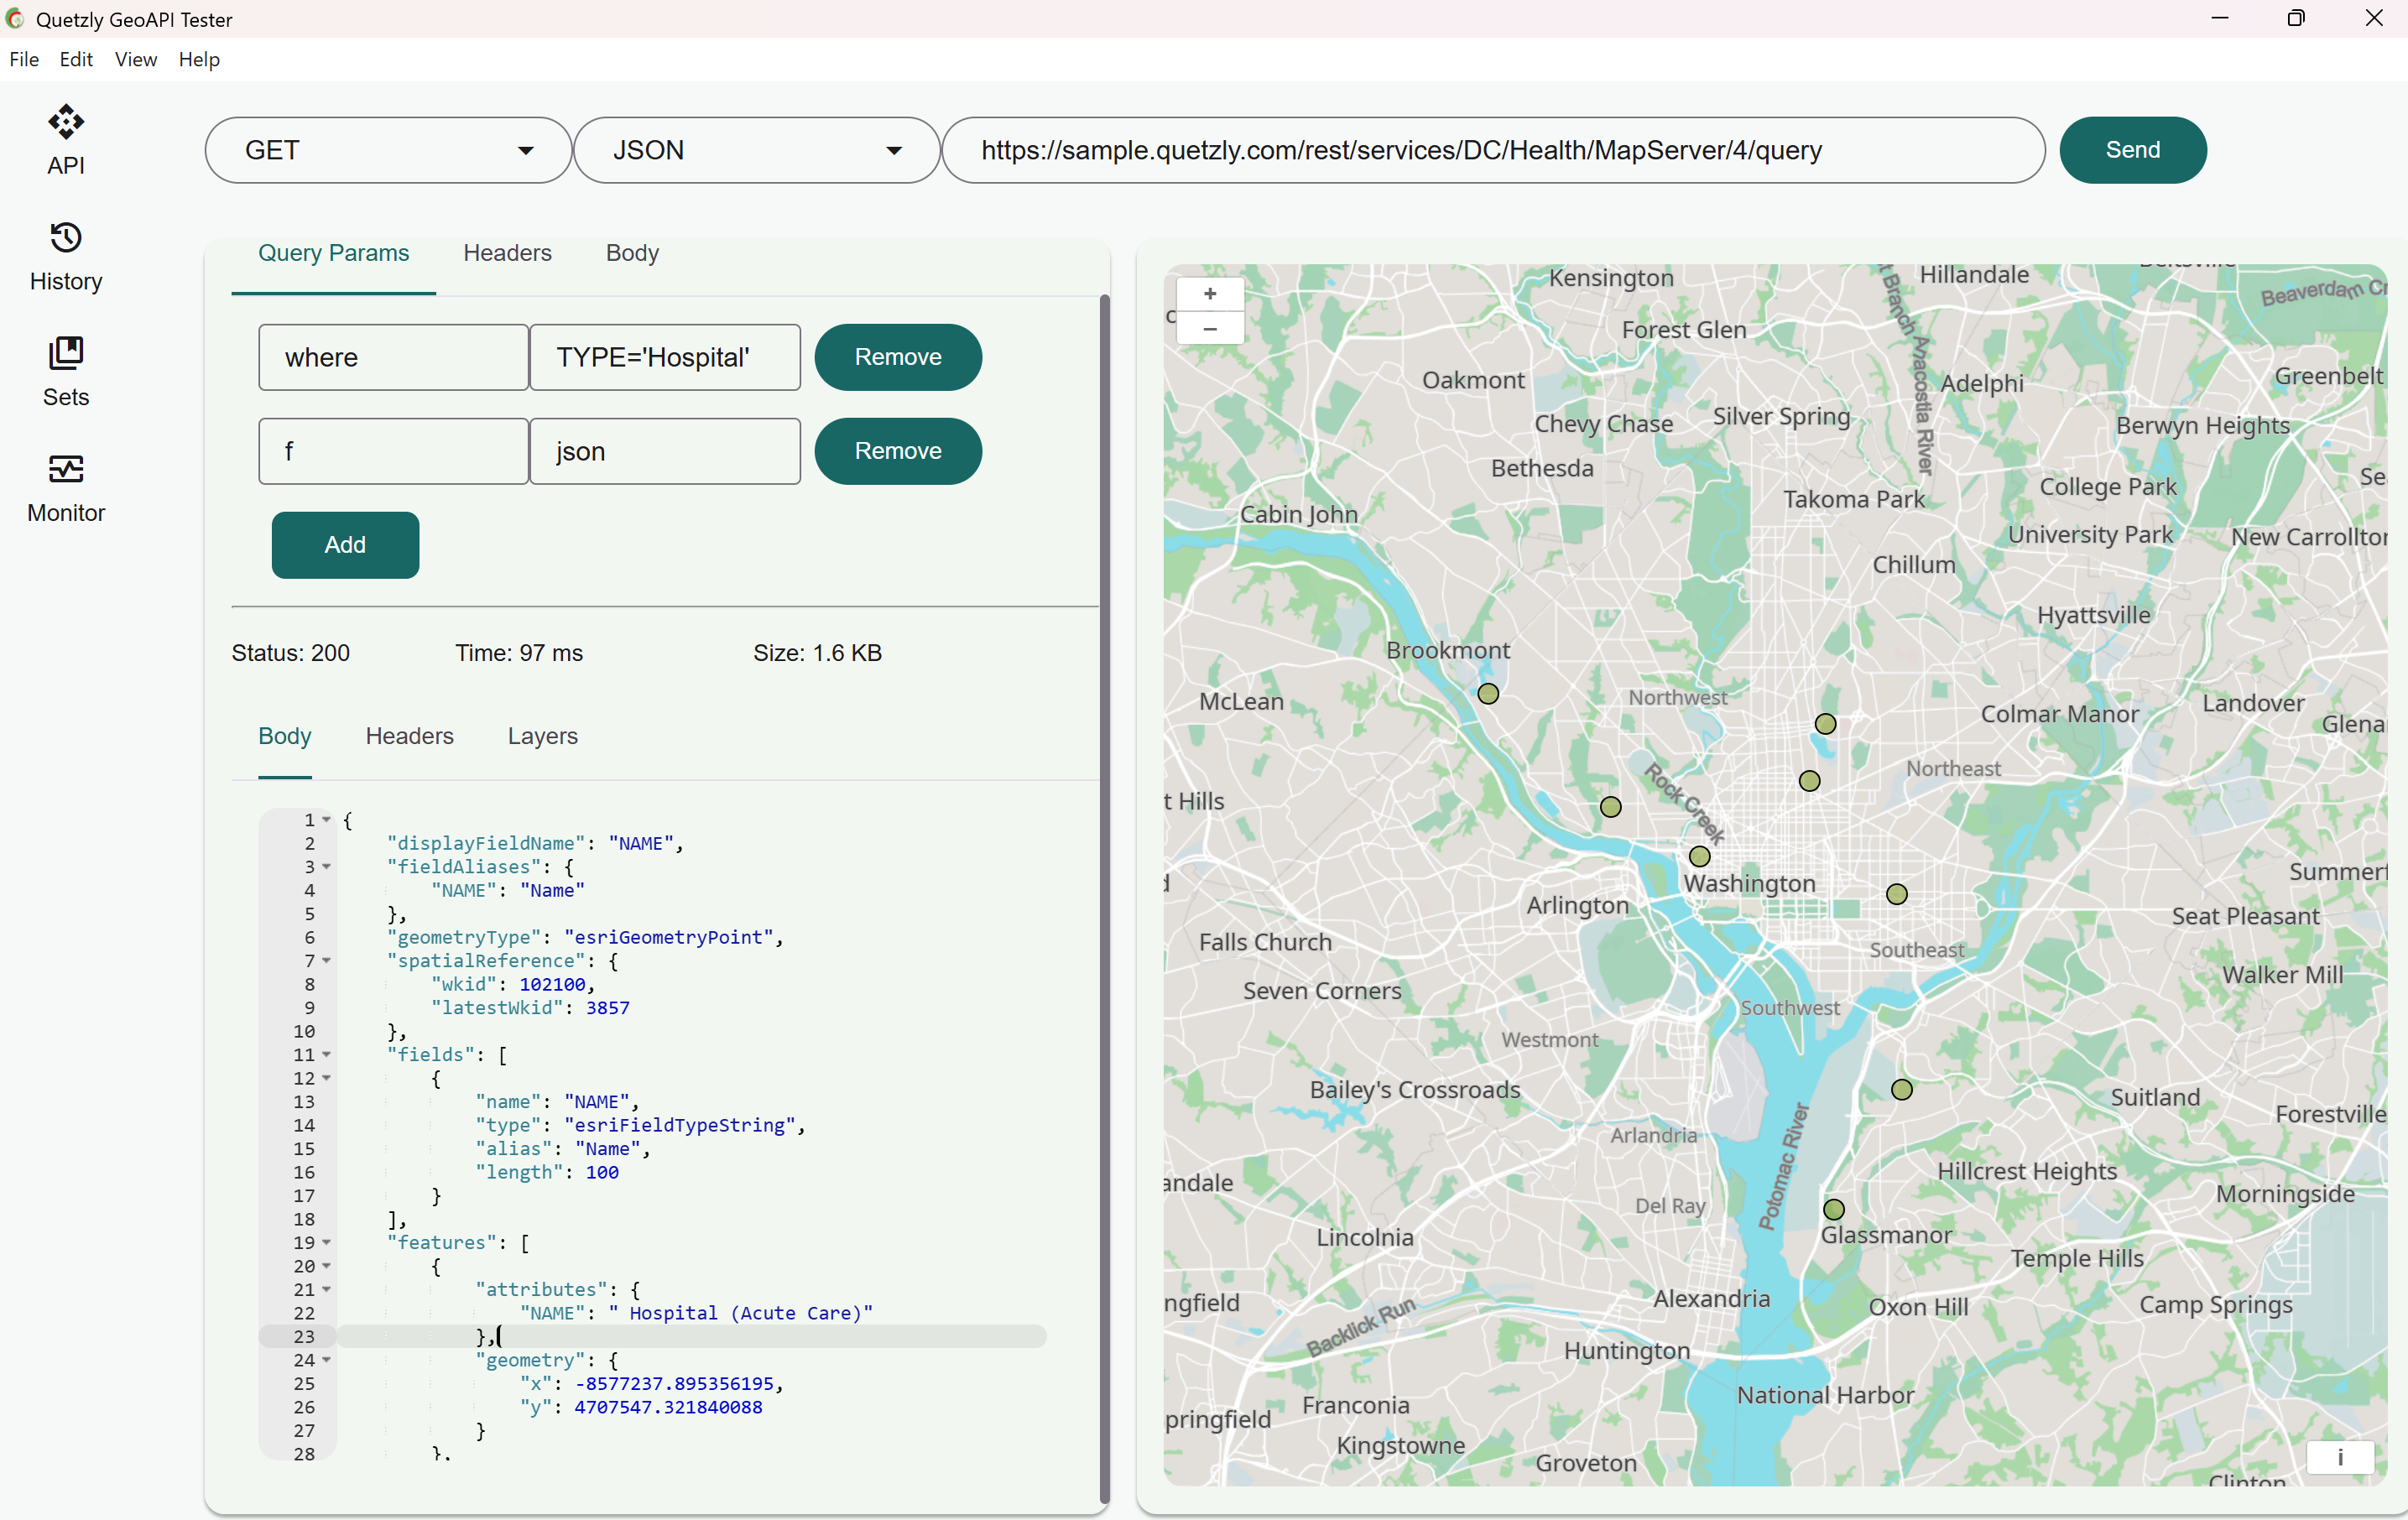
Quetzly is a purpose-built GeoAPI testing tool designed for developers and GIS managers who oversee geospatial web services. As a browser-based solution, it falls into the lightweight monitoring category, ideal for teams that need quick verification without enterprise infrastructure. Its core value lies in continuous background scanning that catches service errors before they reach end-users. The tool supports multiple protocols including ArcGIS REST, OGC WMS/WFS, and GeoJSON, and presents results through an interactive map interface that visually highlights endpoint health. With no scripts or complex dependencies, Quetzly allows developers to start monitoring in seconds, transforming a traditionally reactive process into a proactive one.
The primary pain point Quetzly solves is the reactive nature of traditional map service monitoring. Without a dedicated tool, developers often discover broken layers or slow endpoints only when users complain via email or a frustrated director escalates the issue. This delayed feedback leads to poor user experience and emergency firefighting. Quetzly shifts the paradigm to proactive monitoring by continuously polling each endpoint and reporting failures instantly. This is especially critical for organizations that serve public-facing map applications, where downtime directly impacts credibility and operational workflows. Additionally, manual testing using browser DevTools or custom scripts is time-consuming and error-prone, creating maintenance overhead that Quetzly eliminates.
Quetzly's Background Scanning feature continuously monitors every registered geospatial service at configurable intervals. This process works by sending requests to each endpoint and analyzing the responses for status codes, layer availability, and data validity. When an error is detected, the tool surfaces it directly in the browser with clear tooltips that describe the issue—such as 'Layer load error' as shown in the accompanying screenshot. This eliminates the need to manually check each service or write custom scripts. The benefit is immediate awareness: developers can see the exact error without opening additional tools, reducing the time to identify root causes from hours to minutes. This feature is always active in the background, providing peace of mind that any service degradation is caught early.
The Services Directory Dashboard gives a high-level overview of all public services in a single visual interface. It displays instant counts of services, along with clear Pass/Fail assertions that let you see the overall health at a glance. Each service is represented with a status indicator, so you can immediately spot which endpoints are experiencing issues. This dashboard is particularly useful for managers and team leads who need a quick summary without diving into technical details. The assertions are based on the actual test results from background scans, ensuring that the dashboard always reflects the current state. By presenting this data visually, Quetzly helps teams prioritize fixes and communicate status to stakeholders without sifting through logs or spreadsheets.
admin
Beyond real-time monitoring, Quetzly offers a Professional Reports feature that generates comprehensive PDF summaries of service health. Users can run a weekly health check to document uptime, errors, and overall service conditions. These reports are designed for stakeholder communication, allowing teams to prove reliability and track improvements over time. The reports convert complex technical information into an accessible format suitable for directors, auditors, or clients. Additionally, Quetzly's architecture is intentionally lightweight: it requires no server installation, no GIS Pro license, and no lengthy setup process. This makes it a straightforward alternative to enterprise solutions like ArcGIS Monitor or custom Python scripts. The result is a low-maintenance tool that delivers core auditing capabilities without the associated costs or complexity.
Quetzly operates as a browser-based application that you access from any modern browser. The workflow begins by adding your geospatial API endpoints—whether they are ArcGIS REST services, OGC WMS/WFS layers, or GeoJSON URLs—through a simple interface. Once added, the tool immediately starts its background scanning process, continuously polling each endpoint at a set interval. The results are displayed in two main views: the Services Directory Dashboard for overall health and a detailed map view that visualizes each service's layers and errors. When an error is detected, a tooltip appears with a description, and the service status is updated. Users can then investigate the error details and share findings via the PDF report generator. This entire flow is designed to be intuitive, requiring no scripting or complex configuration.
A typical use case is a GIS team managing dozens of WMS services for a university mapping portal. Previously, they relied on user complaints to detect outages. With Quetzly, they set up background scans once and receive instant browser notifications when a layer fails to load. This reduces response time from hours to minutes, preventing student and faculty frustration. Another scenario involves a small consulting firm that needs to prove uptime to clients. They use Quetzly's weekly PDF reports to document 99.9% availability, strengthening their service-level agreements. For developers maintaining hybrid map stacks (ArcGIS and OpenLayers), Quetzly's multi-protocol support lets them monitor all endpoints from one dashboard, simplifying troubleshooting across different environments. The outcome is consistent service reliability, fewer emergency fixes, and better communication with non-technical stakeholders.
The primary users of Quetzly are GIS developers, web mapping engineers, and technical managers who need a straightforward way to monitor geospatial API health. It runs on any modern web browser, making it platform-agnostic and suitable for both Windows and macOS environments. The tool's tech stack is entirely client-side, so there are no server dependencies or ongoing infrastructure costs. Pricing is designed to be affordable and transparent, positioning Quetzly as a cost-effective alternative to enterprise monitoring platforms. Whether you are a startup deploying a simple GeoJSON feed or a large organization managing hundreds of ArcGIS services, Quetzly scales to your needs without the overhead. In summary, Quetzly delivers essential GeoAPI testing and monitoring capabilities in an accessible, browser-based package, ensuring your maps stay reliable and your team stays proactive.
GIS developers, web mapping engineers, and technical managers who maintain geospatial APIs. Also suitable for small to medium organizations that need lightweight monitoring without enterprise overhead. Users with roles like GIS administrator, Devops engineer supporting mapping services, or consultant providing uptime reports will find Quetzly immediately useful. It is also ideal for educators and researchers running map services who want to ensure availability for their users.