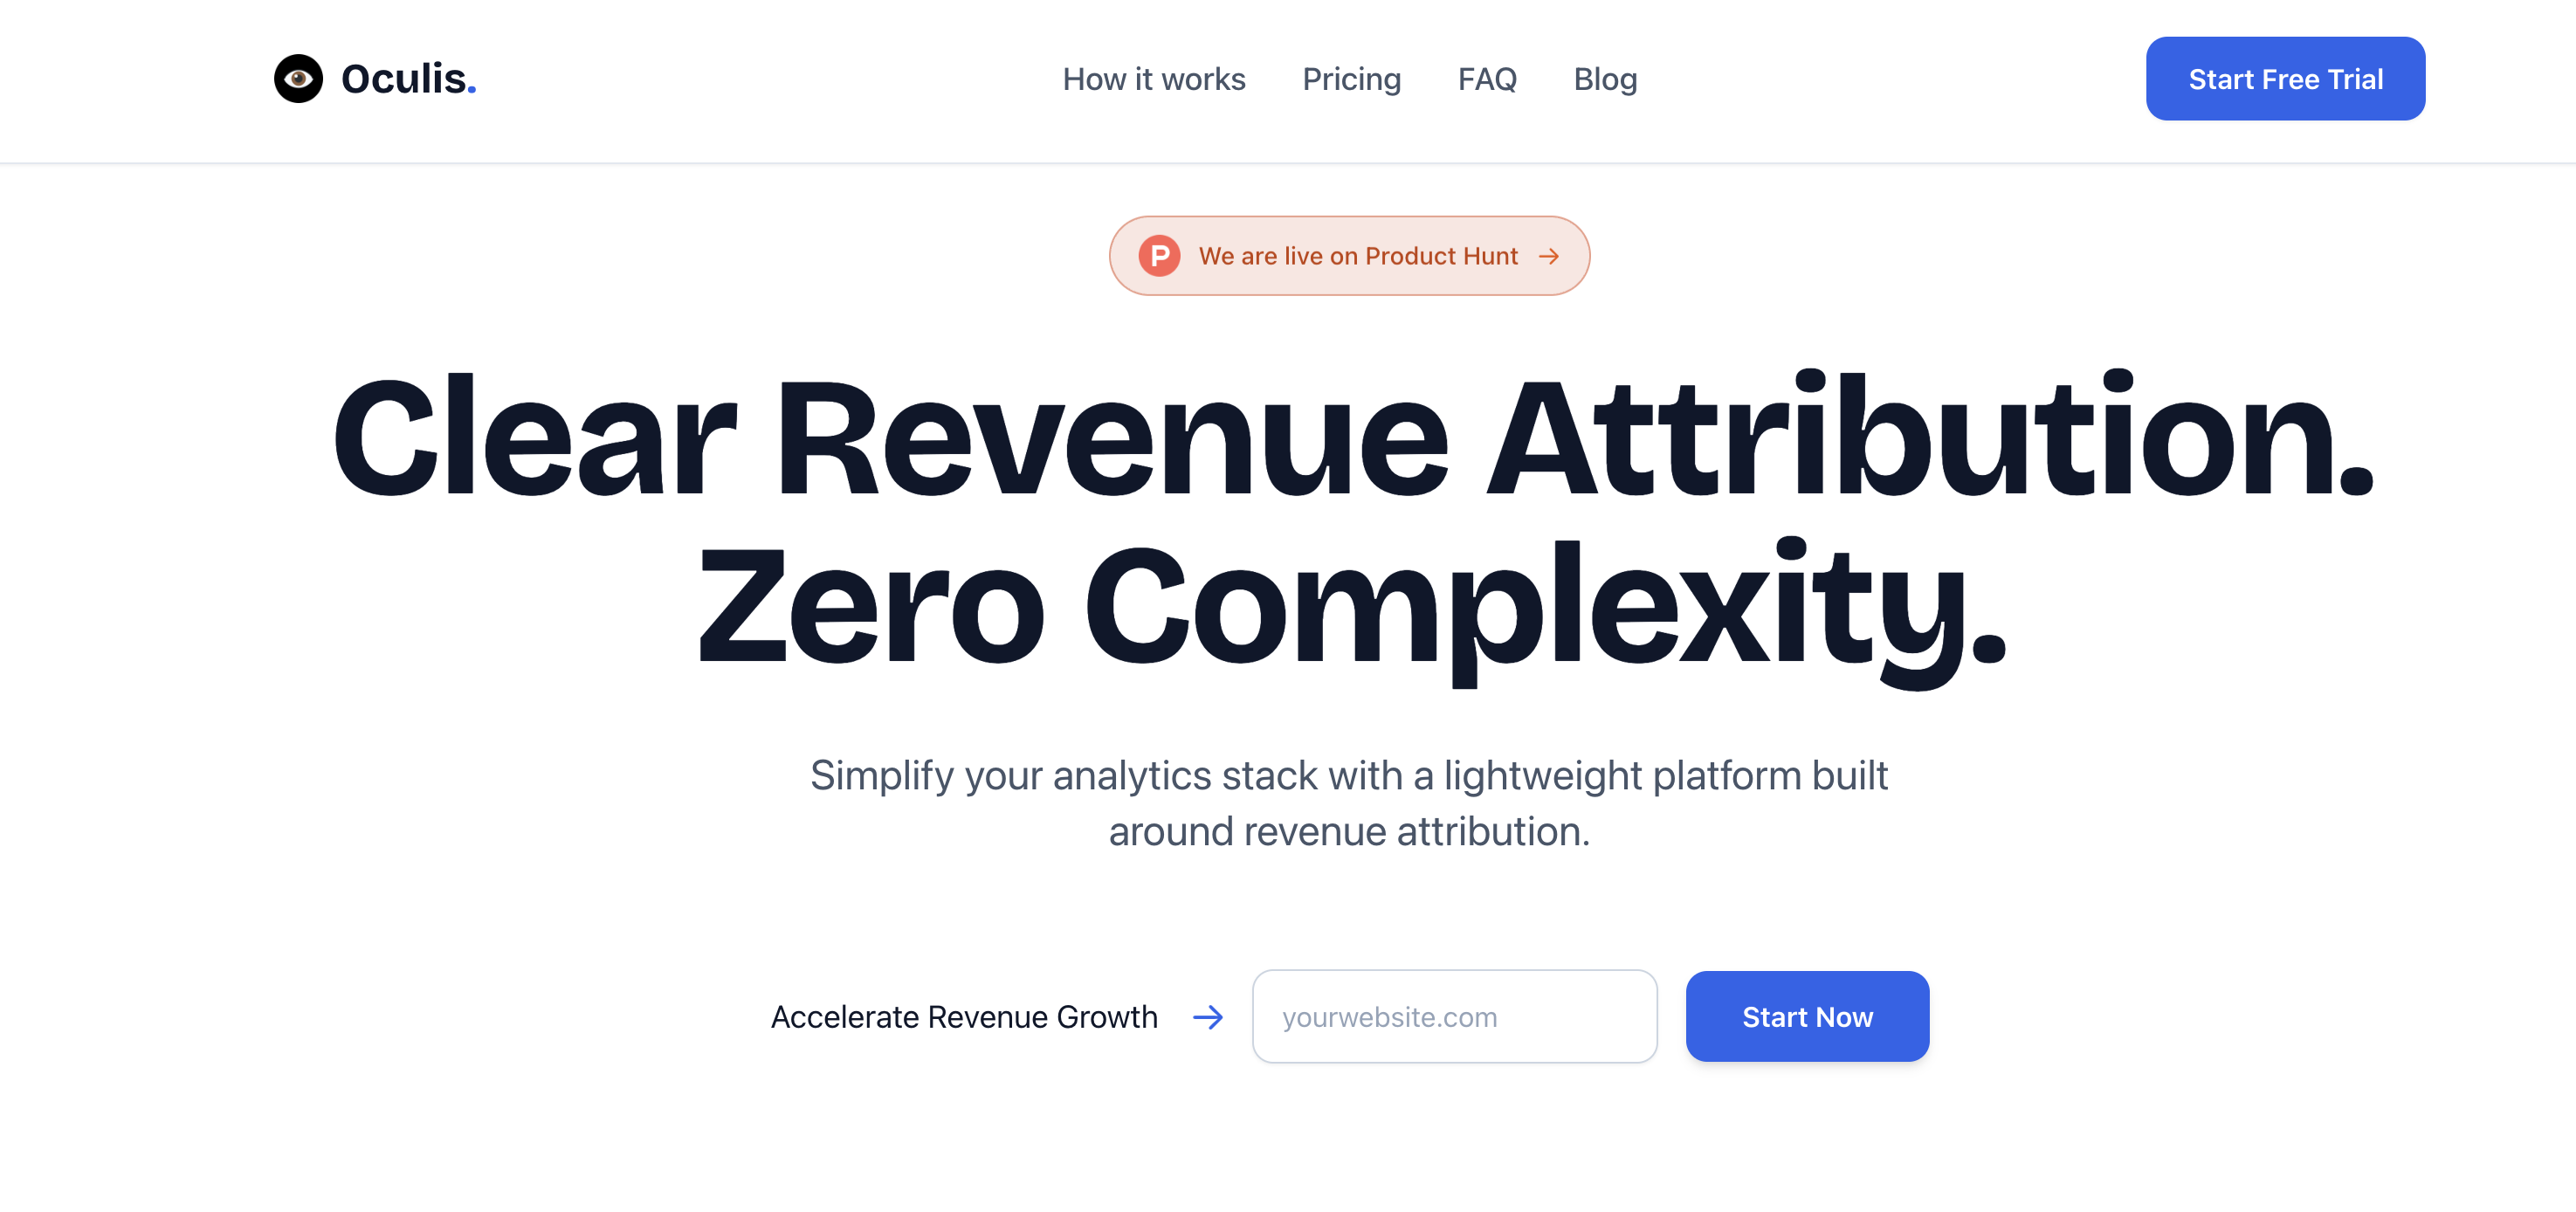
Oculis Analytics is a revenue attribution analytics platform designed for founders and growth-focused teams who need to understand exactly how their marketing efforts generate revenue. By tracking every visitor from first click through payment to renewal, it provides a complete picture of customer value in a single, lightweight dashboard. The core value lies in simplifying complex data into actionable insights, enabling users to see which channels and campaigns produce the highest return on investment without the overhead of traditional analytics tools. The platform prides itself on a setup time of under two minutes, making it accessible even for non-technical users. It replaces the frustration of flipping between Stripe, Google Analytics, and scattered spreadsheets with one unified view of visitors, revenue, and conversion rates. This revenue attribution analytics tool is built specifically for SaaS companies and digital businesses that need to connect every dollar earned back to its source, allowing them to allocate resources with confidence.
Founders and marketing teams often struggle with a common pain point: they spend money on multiple marketing channels but cannot see which ones actually drive paying customers. Traditional analytics platforms like Google Analytics focus on vanity metrics such as page views and sessions, leaving users to piece together revenue data from separate systems. Oculis Analytics solves this by directly attributing revenue to each visitor and channel, showing exactly how much money each source brings in. This eliminates guesswork and stops wasted ad spend on channels that generate traffic but no conversions. For bootstrapped startups and lean teams, every marketing dollar must count, and knowing the precise revenue per visitor from each channel means they can double down on what works and cut what does not. The tool also tracks the full customer journey from first visit to subscription renewal, providing clarity on long-term value rather than just one-time purchases.
The first major feature group is the One Dashboard, which consolidates all essential metrics into a single screen. Users can see page views, unique visitors, total revenue, revenue per visitor, and conversion rate at a glance. This eliminates the need to toggle between different tabs or export data manually. The dashboard updates in real time and presents a clear overview of business health. How it works is simple: once the lightweight tracking script is installed, Oculis automatically begins collecting visitor data and matching it to Stripe subscriptions or other payment events. The benefit is immediate visibility into whether marketing efforts are translating into actual revenue, allowing teams to make fast, data-driven decisions. This feature is particularly valuable for founders who want a high-level snapshot without sifting through complex reports.
admin
The second feature group is Traffic That Pays, which provides a breakdown of revenue per visitor by marketing channel. It lists referrers such as Google, ChatGPT, Bing, DuckDuckGo, Yahoo, and Facebook, along with the number of visitors, revenue generated, and revenue per visitor for each source. Users can also see breakdowns by medium—direct, organic, referral, or campaign. The feature uses a simple table format with icons for each referrer, making it easy to scan and compare. Why it is useful: instead of relying on click-based attribution models that give credit to the last touchpoint, Oculis shows actual dollar amounts tied to visitors. This helps teams identify undervalued channels that drive high-quality traffic and avoid over-investing in channels with low conversion rates. The site example shows that direct traffic had a revenue per visitor of $0.25, while other channels like ChatGPT and Google brought fewer visitors but might have different revenue patterns.
The third feature group includes Retention analytics and Custom Events. The retention feature presents a subscription retention cohort table, showing how many subscriptions remain active month over month. For instance, the total cohort of 35 subscriptions had 68.6% retention at Month 1, dropping to 42.9% at Month 2, and 25.7% at Month 3. This allows teams to watch each cohort's performance and identify when churn accelerates. Custom Events let users drill down into visitor journeys by tracking specific actions like sign-ups, CTA clicks, QR code generations, and downloads. The events list from the demo includes tracked events such as qr_generated_static, header_dashboard_click, hero_get_started_click, and more, along with their counts and unique visitors. Together, these features enable product teams to spot drop-off points in the funnel and retention teams to proactively reduce churn before it eats into monthly recurring revenue.
Oculis Analytics works through a lightweight JavaScript snippet that users add to their website. Setup takes under two minutes—simply paste the code and start collecting data. The platform then automatically maps visitor sessions to revenue events by integrating with payment providers like Stripe. It tracks the entire customer lifecycle from the first page view through payment and ongoing subscription renewals. The dashboard surfaces key metrics without requiring users to configure complex funnels or goals. The approach is minimalistic: focus on the numbers that actually move the business—visitors, revenue, conversion rate, and retention. No unnecessary clutter, no endless settings. The tool continuously updates with new data, and users can explore visitor journeys to understand individual paths through the site. This straightforward methodology makes advanced attribution accessible to non-analysts while still providing the depth needed for informed decisions.
Concrete use cases from the site and testimonials illustrate the platform's value. A growth team can use the channel revenue breakdown to see that direct traffic generates $0.25 per visitor, then decide to invest more in content that drives direct visits. A digital product team can look at top pages to see which ones attract the most visitors and then analyze conversion events to fix underperforming pages. The testimonial from Fred, founder of SupaBird, says Oculis shows from which blog article exactly he got recent revenue, helping him focus on what drives sales. A retention team can monitor cohort retention curves monthly and email at-risk subscribers before they churn. Ops teams get traffic, revenue, and retention on one screen, stopping the need to glue dashboards together. Overall, users gain clarity on marketing ROI and can shift resources to the highest-impact activities, leading to more efficient growth.
Oculis Analytics is built for founders, growth teams, digital product teams, retention teams, and ops teams who want a simple, revenue-focused analytics solution. It is ideal for SaaS companies, online businesses, and any site with subscription or payment events. The platform is web-based and lightweight, requiring no technical maintenance. Pricing details are not explicit on the main page, but a dedicated pricing page is linked, suggesting tiered plans for different scales. There is a free tier to get started, and the tool has been featured on Product Hunt and other directories. The target audience includes early-stage startups that need to maximize every marketing dollar, as well as more established teams that want to replace complex, multi-tool setups with a unified analytics hub. The core takeaway is that Oculis provides clear revenue attribution without complexity, enabling laser-focused growth and data-driven decisions.
Founders, growth teams, digital product teams, retention teams, and ops managers at SaaS companies and online businesses who need to connect marketing spend to actual revenue. The tool is built for lean startups where every dollar counts, as well as more established teams looking to replace complex multi-tool stacks with a unified, lightweight analytics platform. It is especially useful for anyone frustrated by vanity metrics from traditional analytics and seeking clear attribution from first click to subscription renewal. Testimonials from founders of YourWebsiteScore, SuperX, and SupaBird reflect the core audience: bootstrapped entrepreneurs and product leaders laser-focused on growth.