Visit
0 upvotes

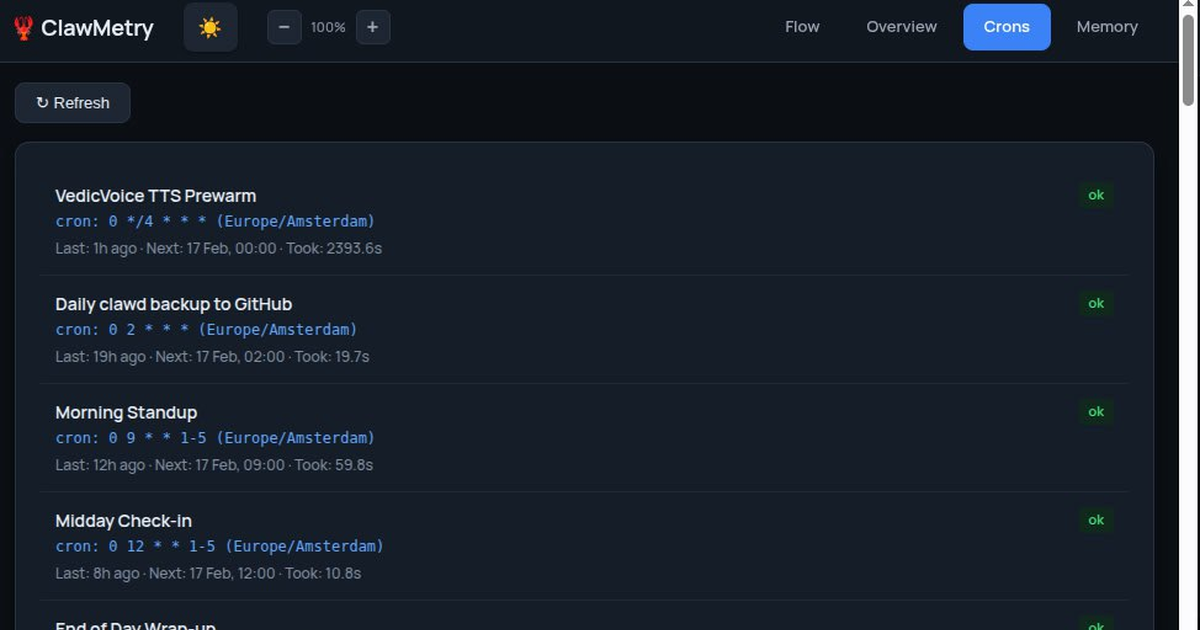
ClawMetry is a free, open-source dashboard for monitoring AI agents. It provides real-time tracking of token costs, cron jobs, sub-agents, and memory.
ClawMetry is a real-time observability dashboard specifically designed for OpenClaw AI agents. It provides comprehensive monitoring capabilities to help developers understand what their AI agents are actually doing during execution.
The dashboard shows every step of sub-agent activity including what files they're reading, what commands they're running, what tools they're calling, and what they're thinking. It features live flow graphs showing channels, gateway, models, tools, and nodes updating in real-time. The system tracks tokens in/out, cache hits, response times, and cost per call. It monitors cron jobs, service uptime, disk usage, and active sub-agents. Session history logs every session with timeline, tool calls, and cost tracking. It integrates with OpenClaw's Mission Control task system to show which agents are on which tasks.
The product works by providing a comprehensive dashboard that visualizes agent activity across multiple dimensions. It hooks into the OpenClaw ecosystem to capture real-time data about agent behavior and performance metrics.
Benefits include eliminating guesswork about what AI agents are doing and providing detailed cost breakdowns per session, per model, and per tool. Use cases include monitoring complex AI agent workflows, tracking token usage costs, and debugging agent behavior.
The tool targets developers working with OpenClaw AI agents who need visibility into their agent operations. It runs wherever OpenClaw runs, including laptops, servers, Raspberry Pi, and various cloud platforms.
Key Features
- •Sub-agent monitoring shows every step including files being read, commands running, tools being called, and agent thinking processes with summary, narrative, and full logs
- •Live flow graph displays channels, gateway, models, tools, and nodes all wired up and updating in real-time as activities occur
- •Token and cost tracking monitors tokens in/out, cache hits, response times, and cost per call to provide essential usage metrics
- •
Publisher
A
admin
Launch Date2026-02-19
Platformdesktop
Pricingfree